And Esri’s Tapestry Segmentation Data Helped Enhance the US Census Bureau’s New Outreach Model
Each decade, the US Census Bureau evaluates and modernizes its enumeration methods. For the 2020 Census, this has resulted in GIS being used in more ways than ever to get the count right.
“We’ve incorporated the use of geospatial technology into every aspect of the design for the 2020 Census,” the Census Bureau’s geography division chief, Deirdre Dalpiaz Bishop, said in an interview.

“We’ve deployed several key innovations that are going to make it easier and more secure for folks to respond and participate in the census,” said Census Bureau deputy director Ron S. Jarmin at the 2019 Esri User Conference (Esri UC), where key staff members from the geography division presented at the Plenary Session. “We have a team of dedicated, smart geographers who have been working hard over the last several years to develop, deploy, and [test] these [innovations].”
Those “last several years” have been crucial to the upcoming census, according to Bishop. “During this decade, we’ve been building our foundation continuously, whereas in the past, we’ve waited until the end of the decade,” she said. “This is a much better approach.”
There are four main components to conducting a census in the United States. First, the Census Bureau has to figure out where to count. This involves building and maintaining an address list and a spatial database to make sure the agency has an accurate accounting of every address in the nation. Next, the bureau has to use that address list to invite people to respond—ideally on census day, April 1, 2020. For households that don’t respond promptly, the Census Bureau then has to send enumerators door to door to try to encourage those people to fill out their forms. Finally, the bureau has to release the results. Apportionment counts for the US House of Representatives are due to the president of the United States by December 31, 2020, and state governments need to receive their redistricting data no later than March 31, 2021.
All this work depends heavily on the Census Bureau’s geographic database, the MAF/TIGER System (which stands for Master Address File/Topologically Integrated Geographic Encoding and Referencing). This is the master address list and spatial database that contains every state, county, city, tract, block, and address in the nation—more than 20 million unique geographic areas—along with the geographically located data for each of them.

“Throughout the decade, we have partnered with tribal, state, and local governments to ensure a complete and accurate database,” said census geographer John Pollicino during the agency’s plenary presentation. “Our partnerships…have enabled us to validate more than 106 million addresses and millions of miles of roads, [as well as] reengineer our address canvassing operation, the method through which we update and validate our address list.”
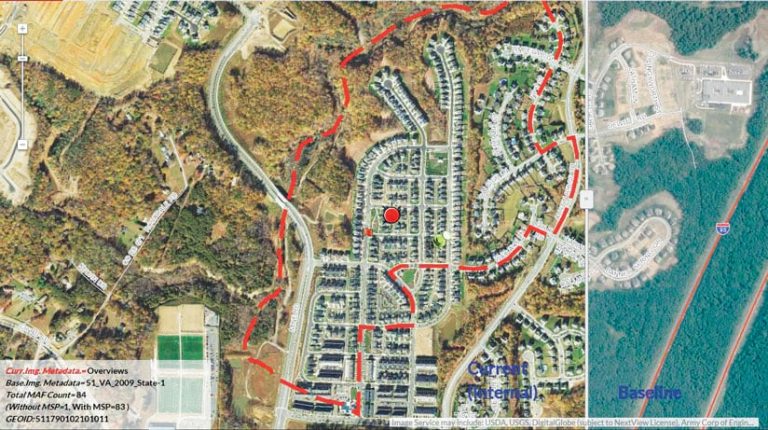
While the Census Bureau used to verify all its address data in the field, this time around, it used satellite imagery and geospatial technology to see what places looked like 10 years ago compared to now. According to Bishop, this allowed the Census Bureau to validate 65 percent of addresses in the office, meaning that only 35 percent of addresses had to be validated in the field.
“What could take over two hours to canvass in the field now takes less than two minutes in the office,” Pollicino said in his presentation.
And instead of having to hire 150,000 address listers to walk every block in the United States, as the agency did for the 2010 Census, it only had to hire about 40,000 people to do that work. This also enabled the bureau to reduce the number of address canvassing offices it opened from 151 to 39.
The next part of the census, of course, is getting people to respond. For 2020, the Census Bureau is inviting people to fill out their questionnaires on the internet for the first time.
“People can still respond by phone or using the traditional paper questionnaire if they want to,” said Bishop. “We want to generate a full count, so we’re giving people options.”
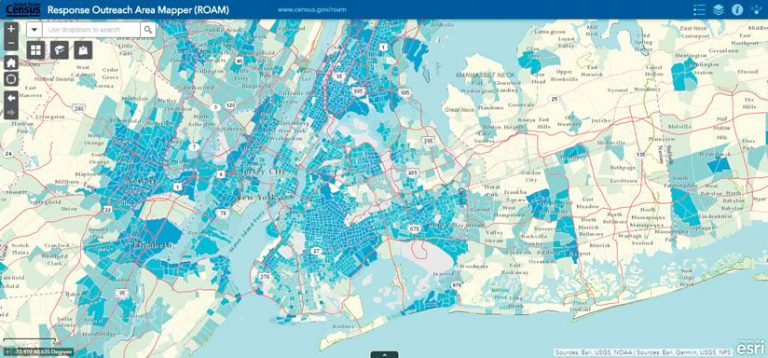
The costliest part of the census is knocking on people’s doors to get them to respond. That’s why the Census Bureau developed the Response Outreach Area Mapper (ROAM) to streamline that process.
“We’ve used geospatial technologies—a lot of Esri technology—to help map the hardest-to-count areas across the country,” said Bishop. “ROAM is used to help direct our outreach efforts to motivate people to self-respond.”
One of the ways the app does this is by predicting which populations are most and least likely to self-respond to the census, as well as whether they are more or less likely to fill out their forms online. With this information, the Census Bureau can tailor its outreach messaging to particular populations in specific areas and encourage self-response via the most accessible methods.
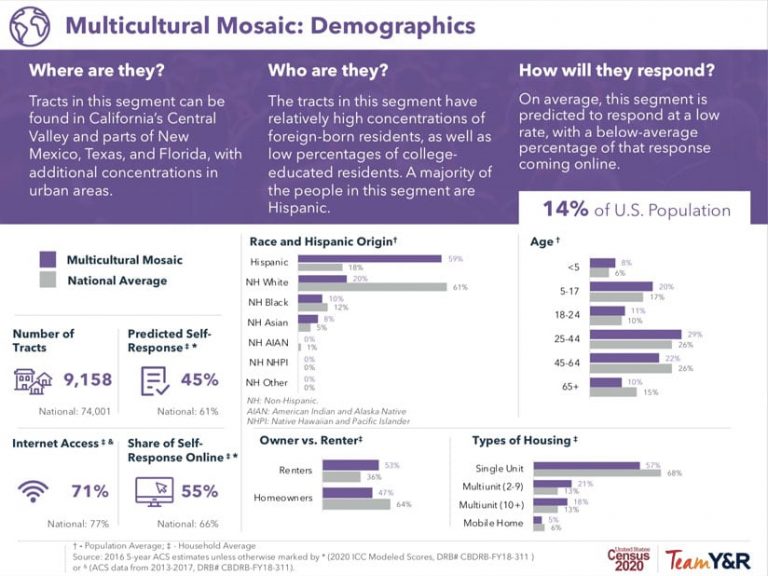
ROAM does this by using an audience segmentation model that the Census Bureau developed with its communications contractor, Team Y&R. The model splits census tracts into groups with populations that have similar media consumption habits and comparable census mind-sets. For example, people who live in areas deemed Responsive Suburbia are the most likely to self-respond to the 2020 Census and will probably fill out their forms online, while people located in the Sparse Spaces tracts are expected to self-respond at low rates, and they probably won’t do it online.

Based on Census Bureau research published in 2018, the core variables in this audience segmentation model rely, in part, on Esri’s Tapestry Segmentation data, which divides US residential areas into 67 distinctive market segments at the neighborhood level based on residents’ socioeconomic and demographic compositions. The study found that the Tapestry segments—which are broken down into 14 LifeMode groups (markets that share a common experience or significant demographic trait) and 6 Urbanization groups (markets in similar locations)—corresponded with the Census Bureau’s predicted self-response rates for populations with comparable characteristics.
“The Census Bureau will be able to use this research to create tailored messages, craft communications materials, and identify efficiencies when determining where, when, and how to allocate digital advertising about the 2020 Census,” said Thomas Gibbs, the commerce account team lead at Esri. “This shows real innovation from the Census Bureau in modernizing some of its approaches.”
With the geographic technology in ROAM—plus a new GIS-based app called ECASE that will digitize field-based enumeration work—the Census Bureau expects to hire fewer than 400,000 people to conduct nonresponsive follow-up operations, as opposed to the 600,000 people it needed last time. And it plans to have 248 nonresponse follow-up offices instead of 494.
“By mid-May, we estimate that 60.5 percent of housing units will self-respond to the census,” said Bishop. “For the rest, which we expect to be about 50 million households, we’ll go knock on doors.”
As responses come in, the Census Bureau will tabulate the data and ensure that it’s assigned to the correct location. The agency will be ready then to deliver apportionment plans—which allocate US House of Representatives’ seats among states—to the president by the last day of the year. And by the end of March, local communities will have the redistricting data they need—complete with shapefiles of the geographies—to start redrawing their legislative and voting boundaries.
As Bishop pointed out, “Geographic work continues throughout the entire cycle of the census.”

