Menlo Park Uses GeoPlanner for ArcGIS to Prepare for Rise of Tech Employee Residents

People who lived in Menlo Park, California, in the 1950s and 1960s reminisce about the small, entrepreneurial businesses—such as the first Round Table Pizza, Joe Prein’s Music Store, and Jiffy Burger—that have long served the town.
Today, however, much of the talk centers on the Frank Gehry-designed Facebook headquarters, which opened in the city at the south end of San Francisco Bay last year. About 2,800 employees work in the 430,000-square-foot (40,000-square-meter) facility, according to news reports.
Anticipating enormous growth, the company continues to plan for more office space for its employees. Because Facebook’s workforce is made up of many Millennials who, in general, want to live and socialize in the same areas where they work, these employees also need nearby homes and services.
Menlo Park city planners face the challenge of managing the housing plan for incoming tech workers without spoiling the community’s charm. In the Bay Area, housing is at a premium. Water is a concern as well. So how will the Menlo Park community, with a current population of 33,000, maintain its city’s character while accommodating accelerated growth?
Geodesign is helping Menlo Park answer this question, offering design options to build a sustainable community of the future.
Using Geodesign for City Planning
Menlo Park hired the California-based community planning and urban design company PlaceWorks to analyze questions related to the city’s land use and development.
The firm, an Esri partner, got Menlo Park decision makers and other stakeholders involved in the process. To do analysis, PlaceWorks decided to use the geodesign tools in GeoPlanner for ArcGIS, a web-based app that helps users make location-driven decisions about land use, natural resource conservation, forestry management, and landscape architecture. The app enabled city planners to evaluate the impacts of development, envision scenarios of how the city would grow, and provide input for informed policy decisions.
“We chose GeoPlanner to allow Menlo Park staff, stakeholders, and decision makers to play with the data and see different alternatives,” said Robert Kain, PlaceWorks GIS manager. “With GeoPlanner for ArcGIS, they don’t need any GIS experience. […] GeoPlanner comes with a built-in library and a multitude of context-appropriate landscape layers that are easy to add into your analysis.”
Conducting Web-Based Planning
PlaceWorks consultants met with community leaders to review the city’s general plan and discuss their concerns. City planners needed to know how land-use changes and potential new development would impact transportation, water consumption, job creation, and city revenue.
PlaceWorks mapped constraints on growth and analyzed how an increase in population would affect the city. The firm also weighted the city’s performance indicators in traffic, jobs, and water use and the impact on tax revenues. Planners and community members were able to use these outcomes to evaluate and compare the impacts of growth and see where there was a need for more infrastructure, services, and housing.
Although the measurement tools in GeoPlanner seem simple to a GIS expert, planners working in Menlo Park appreciated their underlying complexity. Users remarked on how easy it was to see land area, measure the distances between areas, and calculate drive times.
“That’s the power of GeoPlanner,” Kain noted. “It doesn’t need to do everything, but it can do many things. People quickly pick it up and get going. When people are able to use the tool to do alternative planning, they seem to take greater ownership in the project. Further, we can make GeoPlanner available on the Internet so that the public can also look at the data and play with it. This way, people feel involved.”
Building Community Consensus
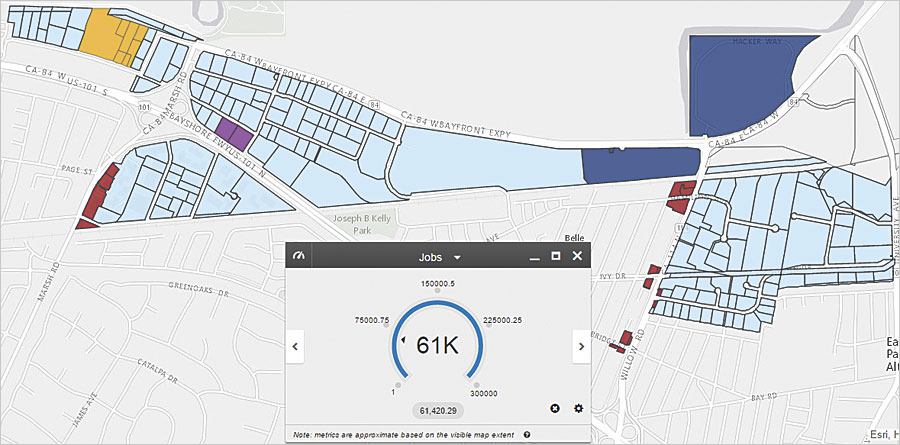
GeoPlanner comes with dashboards that help users compare design alternatives. These dashboards help planners visualize existing land-use conditions and the number of residences in the city. Planners can create geospatial scenarios for their various ideas, see how these would modify land-use features, and estimate the costs and benefits of the proposed development.
For example, PlaceWorks used the app to create a model for water use metrics based on standardized rates of water consumption. With California’s years-long drought still ongoing, water is allocated to cities based on anticipated population growth. With GeoPlanner, users in Menlo Park entered population numbers into the app and ran the model, which then displayed the areas on a map where water demand would change and by how much. Scientific information presented in a geospatial context, like this, can then assist the city with ever more important water rights negotiations.
Dashboards created with GeoPlanner also help urban designers quickly query data and create scenarios to understand the effects of their concepts. Any city’s design needs—whether adding developments, establishing response systems, or managing sea level rise—can be configured into GeoPlanner. Additionally, as part of the Esri platform, the app can be used with other products, such as Esri Maps for Office and ArcGIS Online.
“GeoPlanner made it possible for anyone with Internet access to compare the potential effects of future growth,” said Charlie Knox, a principal for PlaceWorks who worked on the Menlo Park project. “People [from the city]have been able to comment in a meaningful way. City officials could incorporate [that feedback] into their decision making. In this way, GeoPlanner provided a valuable tool for building community consensus.”

