Fireworks are a staple of Independence Day in the United States. On the Fourth of July, cities and towns all over the country host fireworks shows. People often try to add some spark to their own celebrations, too, but in some cases, they use fireworks that aren’t deemed safe and sane.
Every year around this summer holiday, the City of Visalia, California, tracks down revelers in the area who set off illegal fireworks. Leading up to and on the Fourth of July, the fire department’s fire prevention team coordinates with the police department to patrol Visalia in search of people using illegal fireworks.

In years past, fireworks-related calls for service inundated dispatch, and fire and police radio traffic buzzed with, “Fireworks reported in the vicinity of Dunworth and Parker,” or “…Vine and Goddard,” or “…Norman and Sweet.” While these brief descriptions informed patrol teams about the reports and where they were coming from, they gave no context as to how the reports were related to one another or even when they each came in. The din of the radio also hindered patrol personnel from actually listening for fireworks explosions.
Because firefighters and police officers were having to spend so much valuable time figuring out how best to respond to these calls and locate illegal fireworks activity, Visalia’s fire marshal Kurtis Brown reached out to the city’s Information Services (IS) department and the GIS team to help them visualize all the reports. Coming up with a viable solution required a stack of ArcGIS technology.
Solutions for Each Requirement
To begin the project, all the stakeholders from various city departments got together to discuss the challenges of responding to reports of illegal fireworks usage each Fourth of July. Together, staff members from 911 dispatch, the fire department’s fire prevention team, the police department, city administration, and IS and GIS ironed out requirements for the solution, which included the following:
- Allow citizens to report the use of illegal fireworks online to help alleviate the call volume dispatch receives during the Fourth of July season.
- Integrate with the city’s existing computer-aided dispatch (CAD) and automated records management systems (RMS) so that reports called in would automatically go to crews in the field without dispatch having to broadcast them over the radio.
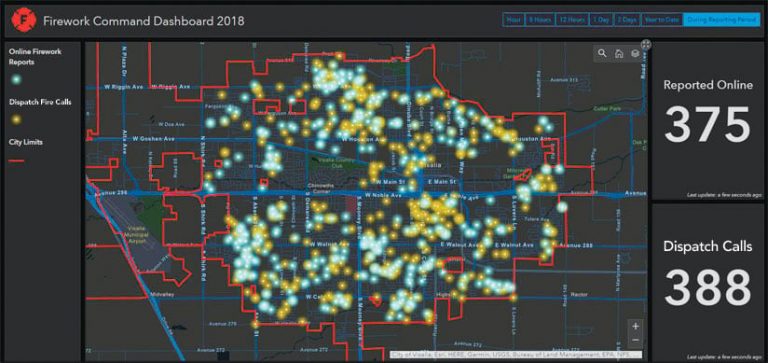
- Have a web-based map that’s updated in near real time with reports coming in both online and from dispatch.
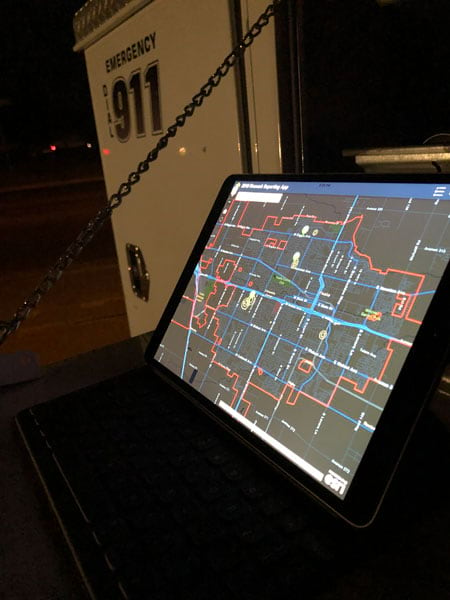
- Enable patrol staff to see, on the map, where they are in relation to other on-duty patrols.
This couldn’t be a one-app solution. These requirements had to be tackled individually with various elements of the ArcGIS platform.
Enabling Internet Reporting
To allow citizens to report illegal fireworks activity via the Internet and have the information show up on a map, the GIS team evaluated several out-of-the-box solutions from Esri, including Crowdsource Reporter, Survey123 for ArcGIS, and the GeoForm template configurable app. Because the fire and police departments were only responding to calls within city limits, the GIS team chose to use Crowdsource Reporter for this, since it can restrict responses to a specific geographic area.
The city also wanted to add some security features to the online reporting app. For instance, stakeholders only wanted online reporting to be available while fire and police personnel were on patrol. They also didn’t want people to submit the same report over and over, so they wanted to restrict the number of reports a citizen could make during a set amount of time. Thus, staff on the IS and GIS teams decided to implement a self-hosted version of Crowdsource Reporter and configure it using ArcGIS API for JavaScript.
Rectifying a Database Disconnect
Integrating the solution with Visalia’s existing CAD/RMS proved to be a bit more difficult. The city’s CAD/RMS uses a non-Microsoft SQL Server relational database management system, while the rest of the city’s GIS resources are stored in ArcSDE, which operates on SQL Server. To remedy this disconnect, the GIS team created a scheduled task that, through a mixture of batch processes and Python scripts, extracts calls out of the CAD/RMS, imports them to a staging table in SQL Server, and then puts all the geovalidated calls on a map based on their latitude and longitude.
Accessing the Map Online
To make the real-time map of all the illegal fireworks reports available to patrol teams via the Internet, the GIS team knew it had to employ ArcGIS Online. But the city had a limited number of named users, so the team published the map as a secure service to ArcGIS Server before adding it to ArcGIS Online. This allowed the city to share the map publicly but keep the layers with the report locations protected so that only employees with authenticated credentials could see and interact with the data.
Tracking Patrol Cars via Cell Phones
Allowing the firefighters and police officers on patrol to see where other patrol cars were located was going to require a new solution as well, since the fire prevention team’s patrol cars don’t have automatic vehicle locators. The GIS team chose to implement Workforce for ArcGIS to track the city-provided cell phones that patrol personnel were already using.
An Effective Patrol
The City of Visalia started its patrols for illegal fireworks usage on June 30, 2018, and continued them through July 5, 2018. Because this was the first year the city had used this new app-based reporting method, IS and GIS staff participated in some of the patrols and consistently monitored the apps to make sure they worked well.

Everything went smoothly, save for one 52-minute outage of the online reporting system on the Fourth of July. During this time, however, residents could still call their reports in to dispatch, and the firefighters and police officers on patrol were still able to see all these reports on the map. Several users remarked on how easy it was to use the apps.
“Our patrols for dangerous fireworks operated smoother and more efficiently than ever before,” said Corbin Reed, senior fire inspector for the City of Visalia. “I was able to easily see calls in real time, decreasing response times drastically. With the live unit tracking, I was able to cover areas efficiently with less overlap of patrols, [and because] users [had] the ability to drop a pin on a map, the locations provided by the public were much more accurate than in years past.”
Given that the map was recording, in real time, both the online reports and calls to dispatch, no radio traffic was dedicated to relaying the locations of suspected illegal fireworks activity for the entirety of the patrol period. This made it easier for the fire prevention team to focus on the patrols and enabled responders to be stealthier than before, since people could no longer listen to fire and police scanners to figure out where the patrols were heading next.
Visalia’s fireworks patrols ended up being far more successful in 2018 than they had been previously.
“Being able to see where all the patrols were located and visualize clusters of reports enabled our team to better allocate resources and effectively target areas that had a lot of activity,” said Brown.
Citizen engagement in reporting illegal fireworks increased by more than 100 percent, with three out of the six days of the patrol seeing more reports made online than via phone calls to dispatch. Additionally, the fire and police departments wrote a record 87 citations, totaling $87,000 in fines, for setting off illegal fireworks—an increase of 74 percent over 2017.
Looking Ahead
Using ArcGIS technology to patrol and pinpoint illegal fireworks activity was a resounding success in Visalia. Because of that, the city plans to use this system for Independence Day fireworks patrols going forward, as well as for other, similar efforts.
The city recently moved from a stand-alone ArcGIS Server to ArcGIS Enterprise, which is greatly expanding the IS and GIS teams’ ability to develop new GIS-based apps and geospatial workflows. In fact, staff members are already looking into issuing citations with Survey123 and implementing Tracker for ArcGIS.
For more information, email gis@visalia.city or visit the city’s open data site.


