Denmark has challenging seascapes to map and chart. Aside from its 42-mile land border with Germany, the peninsular Northern European country—with its scores of bays, straits, and fjords—is surrounded almost entirely by the North and Baltic Seas. Denmark is also composed of more than 400 islands, including the Faroe Islands, located in the Atlantic Ocean between the United Kingdom and Iceland. And then there’s the Danish territory of Greenland, an 836,000-square-mile Arctic island whose mountains descend precipitously to the sea and whose glaciers release icebergs into labyrinthine straits and fjords.
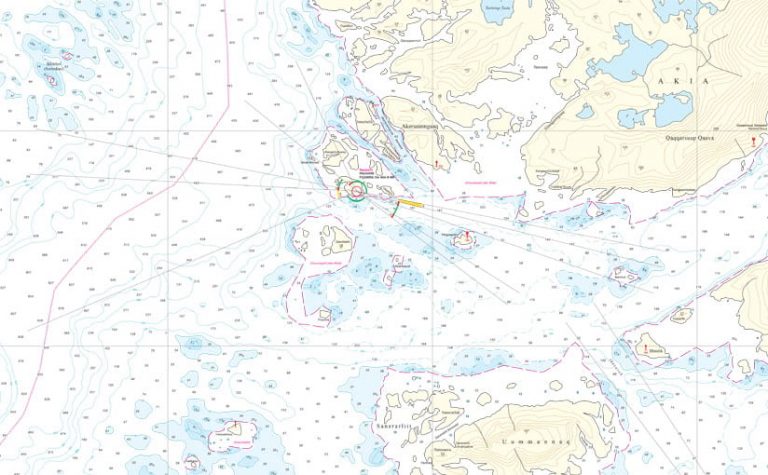
Denmark has a rich history of nautical charting that dates back to the seventeenth century, and many of its navigational products for Greenland were created in the 1960s. The information on those charts was good and sufficient for traditional navigation, but when GPS started to gain prominence in shipping in the 1990s and early 2000s, hydrographic offices around the world had to start producing Electronic Navigational Charts (ENCs). But Denmark’s existing data—especially farther north, around Greenland—didn’t line up with GPS points or new high-quality multibeam sonar readings. So the hydrographic office at the Danish Geodata Agency (known by its Danish acronym GST) needed to take a different approach.

“Though the charts were accurate for the time, we had to georectify old data with new data to produce an update,” said Rune Carbuhn Andersen, head of the Arctic Division at the Danish Hydrographic Office.
But the division kept all its nautical data in separate files, and that was difficult to update. Within a few years, the Greenland group at GST turned to Esri to get help with creating a central, enterprise-wide geodatabase for all the data portrayed on both its paper and electronic charts.
“The way Esri was thinking—of data and a database structure and, eventually, potential automation—that was, in a sense, unique,” said Andersen.
For Greenland, the group implemented what is now called ArcGIS for Maritime: Charting, a complete system for managing and producing maritime data and products. Maritime: Charting stores all the data in Esri’s Nautical Information System (NIS), an enterprise geodatabase, which makes it easier to create data products and incorporate automation.
Development took a few years, in part because so much decades-old data needed to be cleaned and classified and in part because of substantial internal reorganization at the Danish Hydrographic Office. But the division’s close collaboration with Esri paid off magnificently.
“At the end of last year, the Danish Hydrographic Office produced two charts for Greenland that were 70 percent automated,” said Rafael Ponce, the executive consultant for maritime services at Esri. “It was a huge improvement.”
The data modernization project for Greenland was so successful in general that when GST needed a next generation chart production system for all Danish waters, the choice fell again to Maritime: Charting. In February, the agency partnered with Esri and its official distributor in Denmark, Geoinfo A/S, to implement this project, which focuses on both paper and electronic charting.
“By the end of the current project, we expect to have a complete Nautical Information System for all three regions—Greenland, Denmark, and the Faroe Islands,” said Ponce.

We’re trying to help people understand their world; make good decisions from the best available data; and, where possible, identify where we need more data.
Having readily accessible data on the world’s oceans, in a system that enables this information to be used to create a range of map products, is important not only for navigation but also for understanding the 71 percent of the globe that isn’t land. The blue economy—a reference to all economic activity that stems from or affects oceans and other waterways—generates an estimated $2.5 trillion each year and is anticipated to grow at twice the rate of the rest of the global economy by 2030.
“We’re trying to help people understand their world; make good decisions from the best available data; and, where possible, identify where we need more data,” said Guy Noll, Esri’s maritime GIS consultant.
Which is why Esri is working closely with other hydrographic offices—including the National Oceanic and Atmospheric Administration’s (NOAA) Office of Coast Survey and the Lithuanian Transport Safety Administration’s (LTSA) Hydrography Division, among others—to modernize their maritime mapping systems.
“The Esri platform enables the foundational technology needed to develop a marine spatial data infrastructure (MSDI) from which new products and services can be created, transforming traditional hydrographic offices into true geospatial agencies,” said Ponce.
Updated Processes for Greenland Inspire Modernized Methods in Denmark
For much of GST’s recent history, its hydrographic office has been divided into regions: Danish waters and the Faroe Islands, with Greenland on its own. Each division did its own maritime charting and hydrographic mapping without much overlap.
It was during this period that the Greenland group began updating the island’s coastline maps and conflating all its old maritime charts to keep up with the fast pace of modern technology. But data for Greenland was lacking, according to Andersen, and the group was starting from scratch in creating electronic charts, said Ponce. So the team had to establish all new data cataloging routines and come up with its own schemas. Additionally, going from a file-based cartographic production environment to a database-driven environment was challenging.
“Sometimes the data was 50, 60, or more years old, coming from different sources—in some cases, it was local data. There were also sparse bathymetries,” or water depth measurements, said Ponce. “Before creating the central database, the NIS, a lot of work had to be done to just clean and classify the legacy data, which was at different levels of certainty as to how accurate it was, to make it all suitable for producing navigational products.”
That instilled a kind of intelligence in the process, said Andersen, because his team now does quality control on the data as it’s being created. At the same time, the group is putting everything into the S-57 data model, originally a data exchange standard from the International Hydrographic Organization (IHO) aimed at ensuring that all data in ENCs are properly attributed and encoded to be read by Electronic Chart Display and Information Systems (ECDIS). It is essentially obligatory to use this data model, so updating old products in S-57 will be an ongoing challenge for GST and system suppliers like Esri for years to come as they begin to also implement the new S-100 and S-101 data models currently being developed. And while GST is still devoted to making paper charts, given that they’re used widely by professional mariners, the agency is focused on making ENCs. More importantly, it is operating in an ENC-first manner, which reflects where maritime mapping is headed.
“With GST’s data organized around the S-57 standard, the agency can extract a lot of information from it using a combination of geoprocessing tools and Python scripts to automate more and more of the processes associated with making paper charts,” explained Ponce.
Now, the system that was created for Greenland is going to be expanded to Danish waters and the Faroe Islands. But the implementation will be different.
“Danish waters already have a full catalog of ENCs, but those ENCs have been maintained as independent files,” said Ponce. “With the new system, GST is going to produce those in a central database. The improvement will be in streamlining production, bringing all that information into the NIS to create data products more easily and automatically. This will result in GST being able to update its products more frequently.”
This could be decisive for Denmark in gaining a foothold in the blue economy. As ocean-based activities—from shipping, tourism, and fishing to offshore mining and renewable energy production—move farther north, being able to produce a variety of maritime mapping products, quickly, will be key.
“Hydrographic offices around the world are facing new challenges in the twenty-first century, and Esri tools are helping them evolve and address those challenges in a better way,” said Ponce.
For US’s Coast Survey, a Change in Focus to Data Itself
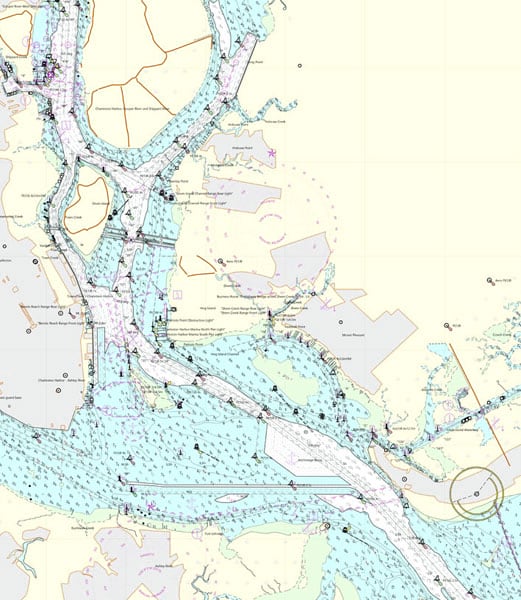
NOAA’s Coast Survey, which delivers navigational products and services for the United States’ 3.4 million square nautical miles of exclusive economic zones and 95,000 miles of coastline, was the first hydrographic office to turn to Esri for nautical charting. In 2007, Coast Survey’s Marine Chart Division (MCD) began using ArcGIS technology to manage its hydrographic data and facilitate the production of ENCs and paper charts. By 2014, the organization was changing its focus from making cartographic representations of its data to managing the data itself.

“As Coast Survey matured as a GIS organization, staff realized that their workflow wasn’t very efficient,” said Noll. “Esri evolved with the organization and gave it new tools, including Products on Demand in ArcGIS for Maritime: Server, plus Python-scripted geoprocessing tools that allowed it to automate certain parts of its production.”
“It’s still an iterative process,” said John E. Nyberg, chief of MCD, “but we do have all our data in a database now, and we’ve moved to an ENC-first approach.”
Unlike at GST, however, Coast Survey is hedging away from paper charts—encouraging mariners to use them more as backups—and more toward ENC-first. This is an important shift, given that, as Nyberg puts it, Coast Survey’s charting dataset is a foundational basemap for the blue economy.
“As the blue economy grows, there’s a need for everything within it to be working from a common framework, using common data content,” said Noll. “That’s what Coast Survey and other hydrographic offices like it maintain.”
Thus, commercial ships with ever-improving navigational systems can exploit this data. Recreational boaters, of which there are many in the United States, can use Coast Survey’s ENCs directly or through partner providers. And all users—from professional mariners to anglers in tiny johnboats—can get up-to-date, high-resolution charts.
“We’ve moved away from the notion that ENCs and paper charts have to be equal,” said Nyberg.
According to Noll, the fact that Coast Survey has gone ENC-first opens the door to a broader production paradigm.
“Because Coast Survey is focusing most of its effort on the data accuracy and quality of the database, and then relying on ArcGIS tools to flag and create new products—soon, automatically—that means it can update its ENCs every week,” he said.
Nyberg hopes that Coast Survey will eventually update its ENCs more often, potentially even as the data is added to the database.

