Team at University of South Carolina Uses Collector for ArcGIS to Assess When, Where Smoking Happens
By Dr. Jan M. Eberth, Kevin Remington, Geoff Schwitzgebel, and Jackie Knight, University of South Carolina; and Sarah Powell, University of South Florida

Self-reported smoking rates among college students range from 9 to 25 percent, with rates in the United States highest among universities in the south. Studies show, however, that smoke-free restrictions in public buildings—including schools—have been associated with decreased smoking frequency in adolescents.
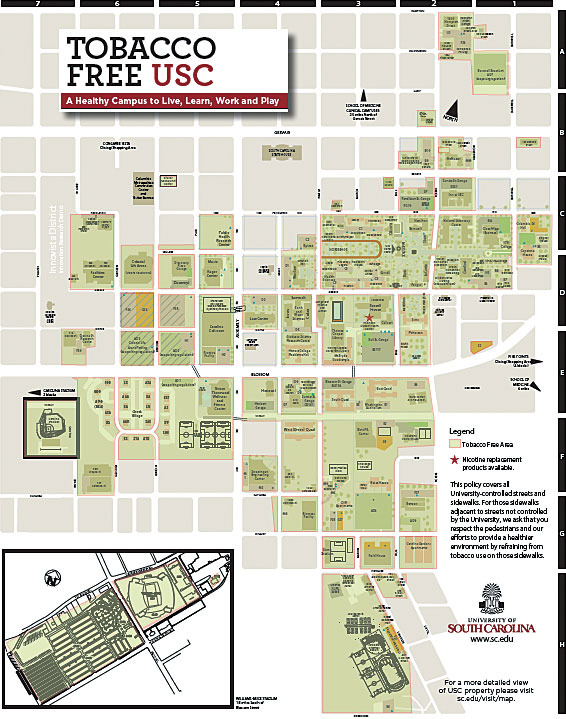
In 2009, the American College Health Association released a position statement recommending nine actions that colleges and universities should undertake to address tobacco policy, prevention, and cessation issues on campus, including strongly worded policies prohibiting tobacco use on all college and university property. Following these guidelines, the University of South Carolina (USC) in Columbia, South Carolina, implemented a campus-wide ban on all tobacco products, including e-cigarettes, in January 2014. The university announced its policy through the USC Healthy Carolina tobacco-free website; added references to the policy in student handbooks; and put up conspicuous signs around campus on buildings, trash cans, and posts along walking paths. The Carolina Community—which consists of students, faculty, staff, and volunteers—enforced the tobacco-free policy rather than university police or security.
Despite all these efforts, there were continued reports of tobacco use on campus. Seeing this as an opportunity to engage students in participatory research, a team of faculty and staff from several departments, together with a number of graduate and undergraduate students, set out to evaluate the presence of tobacco use at USC using GIS. The idea was to have students participate in all phases of the research, including designing the data collection forms they would use in Collector for ArcGIS, gathering the locations of observed smoking violations, and mapping the data in ArcGIS Online.
Customizing Collector, Then Gathering Data

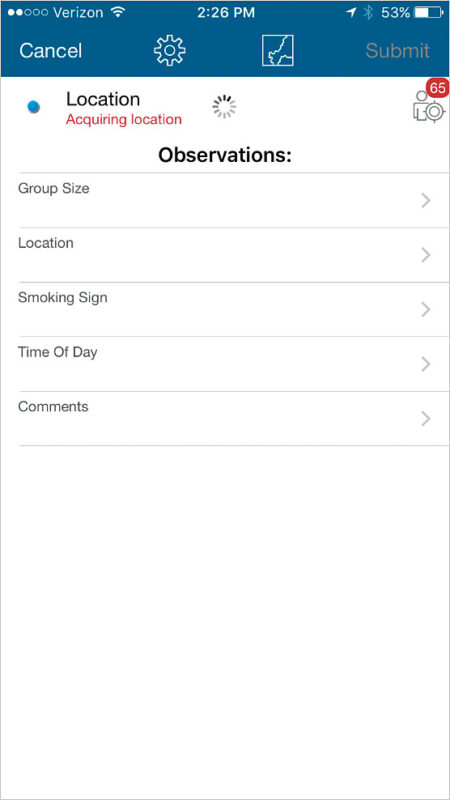
To get the project started, the team first customized Collector to ensure that it recorded the appropriate information. In addition to being able to save the x,y coordinates of where individuals were observed using tobacco products on campus, GIS staff in the Department of Geography modified the app so it contained optional notes to record other variables, including whether there was more than one tobacco user in the area, the location’s proximity to a no-smoking sign, the time of day, and any additional comments.
Once the app was ready to use, a group of trained student volunteers spent October 2015 to March 2016 observing and recording tobacco use on USC’s main campus. Using a weighted, random number generator (which focused on the center of campus, where there’s a greater population density), each volunteer was randomly assigned two locations on campus that they had to monitor for 30-minute to 1-hour blocks of time twice a week for 14 weeks. If they saw anyone smoking cigarettes, cigars, e-cigarettes, pipes, or hookahs, they used their own devices to record the tobacco-use violation in Collector. The app saved and pinned locations to the campus map in ArcGIS Online, where the team could then view and analyze the data.
Accruing and Delivering Valuable Information
At the end of the observation period, student volunteers had completed 54 hours of observation time. They recorded a total of 24 smoking violations—approximately one per 2-hour observation period.

Of the 24 violations, 83 percent were lone smokers (versus smokers congregated in social groups). Tobacco violations took place within sight of signage stating that smoking is prohibited on campus property, as nearly 17 percent of observed tobacco-use violations occurred within view of a no-smoking or tobacco-free campus policy sign. Additionally, approximately 13 percent of observed violators appeared to be external university contractors.
What surprised the team most was the abundance of cigarette and cigar butts found in some areas of campus compared to the relatively small number of smoking violations observed during data collection. This suggests that cleanup efforts are done too infrequently or that violations often occur outside the observation window—at night or on weekends. Based on these sightings, the study team subsequently developed another customized Collector app to gather data on cigarette and cigar butts.
Honing Interventions, and Maybe Creating New Ones
Using Collector and ArcGIS Online, the team at USC obtained the preliminary data it needed on where tobacco-use violations were occurring on campus so the university can hone the smoking interventions it already has in place and perhaps come up with new ones. Furthermore, the students who participated in the project got to use GIS to collect and analyze real-world data, which they used to provide university administration with valuable information about one of its policies.
For more information about using and teaching geospatial data collection for public health research, contact USC assistant professor Dr. Jan Eberth at jmeberth@mailbox.sc.edu.
About the Authors
Jan M. Eberth, PhD, is deputy director of the Rural Health Research Center and an assistant professor in the Department of Epidemiology and Biostatistics at USC’s Arnold School of Public Health. Kevin Remington is the campus GIS coordinator in USC’s Department of Geography. Geoff Schwitzgebel is the GIS manager in USC’s Department of Geography. Jackie Knight is the assistant director of Healthy Carolina Initiatives at USC. Sarah Powell is a graduate student in the University of South Florida’s Department of Epidemiology and Biostatistics. This project was funded in part by an undergraduate research award that Powell received through USC’s Office of Undergraduate Research during her time as a student there.

