Humans’ survival on earth depends on the ocean. It is an important source of food for many species. It impacts climate and weather patterns. And around 90 percent of global trade moves by sea.
Yet that great expanse of dark, deep water is still a mystery. Only 5–10 percent of the ocean has been explored in detail. So we still lack accessible data to protect and manage the marine ecosystems that we rely so heavily on.
In a world of accelerating change, especially when it comes to the climate, this means we are exposing ourselves to unnecessary risk. That is why Esri and the United States Geological Survey (USGS) led an innovative public-private partnership to create the Ecological Marine Units (EMUs), a 3D representation of the world’s oceans.

The EMU map differs from existing maps of marine ecoregions or biogeographic realms because it is globally comprehensive, driven by quantitative data, and truly 3D. With its extensive yet detailed information about all dimensions of the ocean—including the surface and what’s beneath it—the global EMU map champions the wise use of ocean resources and the preservation of environmental resilience.
Big Data for a Huge Project
“While oceans cover about 70 percent of the earth’s surface, the impact of climate change on the oceans—apart from sea level rise—has largely been hidden,” said Dr. Suzette Kimball, director of USGS.
But as Kimball points out, the EMU project is a significant step forward in the quest to comprehensively map the entire ocean.
“This easily accessible map will serve as a fresh resource for improving our understanding of the ocean’s structure—its salinity, temperature, oxygen levels, and nutrients—in millions of places,” she said. “This insight will, in turn, help us better understand the rapid changes in ocean ecology that are now happening around the world.”
The team of scientists and analysts who worked on the project delineated 37 3D regions in the oceans, which became the EMUs. Each unit is a physically and chemically distinct area of the ocean distinguished by six variables: temperature, salinity, dissolved oxygen, nitrate, phosphate, and silicate.
While GIS has been used time and again to map the 2D surface of the ocean, as well as the 2D seafloor, this is one of the first uses of the technology to visualize, characterize, and analyze the 3D volumetric space between the surface and the bottom of the sea on a global scale. What ultimately made this possible were the incredible recent advances in big data analytics.
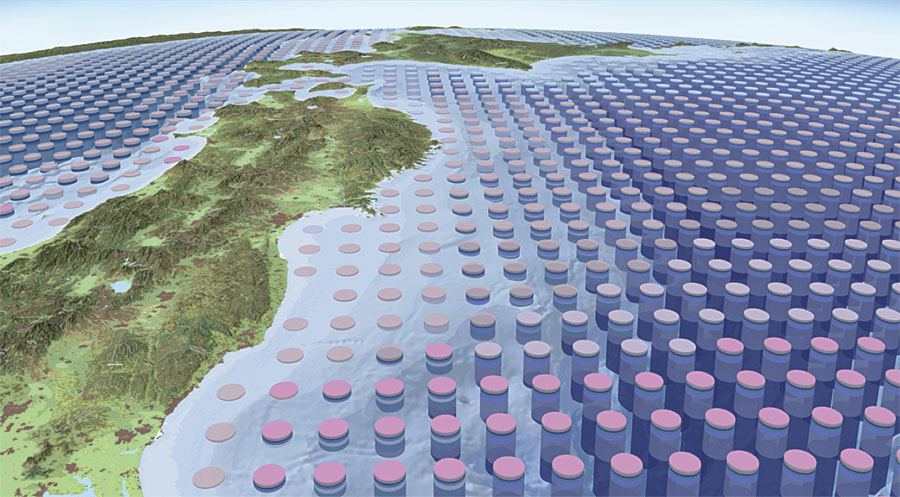
The EMUs are composed of a point mesh framework of approximately 52 million global measurements of six key variables (collected over a 50-year period) that represent the physical and chemical properties of the ocean and are most likely to affect how marine plants and animals respond to their environment. Once this mesh was created, the team applied rigorous k-means statistical clustering to group together areas with similar properties. This resulted in the 37 physically and chemically unique volumetric EMUs—each of which stretches from the ocean’s surface all the way down to the floor.
With the global EMU map, there is now scientific support for marine spatial planning and management (to accommodate the various uses of the ocean, from commercial fishing and shipping to recreation), designing new marine protected areas, and understanding the effects of climate change and other disturbances on all kinds of ecosystems.
Accessing and Implementing the EMUs
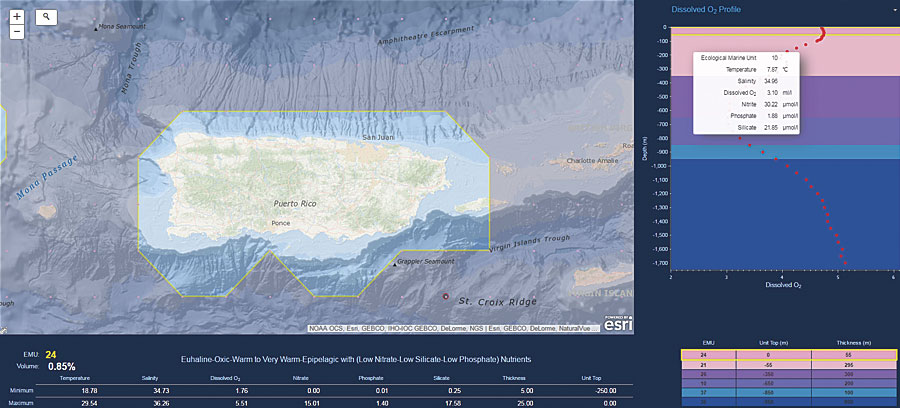
To give users easy access to the EMUs, Esri has built the Ecological Marine Unit Explorer app, which allows users to explore the EMUs—as well as the original data from the National Oceanic and Atmospheric Administration’s (NOAA) World Ocean Atlas—on the web and with mobile devices. Teachers and students can use the Explorer app, free of charge, to view 3D ocean data both in the classroom and in the field, as it is intended to enhance laboratory projects and field exercises.

Working with the EMUs extends far beyond the classroom as well. The EMUs are open data, available in a variety of formats in ArcGIS Online, so anyone can access and share the 3D point mesh and the EMU clusters for the surface of the ocean, the bottom, and the water column in between.
Interest in the EMUs is far-reaching. The project was initially commissioned by the Group on Earth Observations (GEO), an intergovernmental partnership that aims to open up access to earth observation data to help people around the world make better decisions, so the results were always intended to be shared extensively. Additionally, the EMUs were created in collaboration with NatureServe, the Marine Conservation Institute, the University of Auckland in New Zealand, GRID-Arendal in Norway, Duke University, the Woods Hole Oceanographic Institution, New Zealand’s National Institute of Water and Atmospheric Research, NOAA, and the National Aeronautics and Space Administration (NASA), so enthusiasm for the global EMU map is widespread. Already, a number of organizations have expressed interest in using the EMUs, including GEO’s Blue Planet Initiative, the MPA Action Agenda of the World Wildlife Fund’s Global Marine Programme, the Ocean Data Interoperability Platform, the Ocean Biogeographic Information System, the Mission Blue initiative’s Hope Spots program, and the South African National Biodiversity Institute.
This does not mean, however, that the project is finished. Work on the EMUs continues in earnest, with future plans including a global delineation of Ecological Coastal Units (ECUs) at a very fine spatial resolution and the development of global Ecological Freshwater Units (EFUs), now in the very early stages of planning. The team will also be exploring how to conceptually and spatially connect the EMUs, EFUs, and Ecological Land Units (ELUs) at the ECU juncture.
To continue discovering new workflows for teaching and science, everyone is encouraged to apply the methodology used to derive the EMUs to their own areas of interest and using their own high-resolution data. Ultimately, the team hopes that the ecosystem-based management espoused by the EMUs will guide ocean conservation, ocean geodesign, ocean policy, and so much more.
For more information about the Ecological Marine Units map, visit the website, email Dawn Wright , or contact the team at the Ecological Marine Units page on Esri Community.
About the Authors
Dawn Wright, PhD, is Esri’s chief scientist. Kevin A. Butler, PhD, is a spatial statistics product engineer at Esri. Sean Breyer is the ArcGIS content program manager for Esri. Keith Van Graafeiland is a product engineer and ocean content lead at Esri. And Roger Sayre, PhD, is the senior scientist for ecosystems at the USGS Land Change Science Program.


