Esri partners have a profusion of specialties—from fostering collaboration among interagency emergency responders to helping utilities comprehend all aspects of their assets. With ArcGIS Enterprise, Insights for ArcGIS, and more, they are helping organizations around the world keep communities safe and tap into in-depth analysis.
A Fast-Moving Fire, a High-Speed Response
On September 3, 2018, a wildfire broke out at the Bundeswehr Technical Center for Weapons and Ammunition (known as WTD 91 in German), in Meppen, Lower Saxony. With winds at speeds of up to 52 miles per hour, the Moorland Fire spread quickly, threatening several towns. Immediate action was needed.
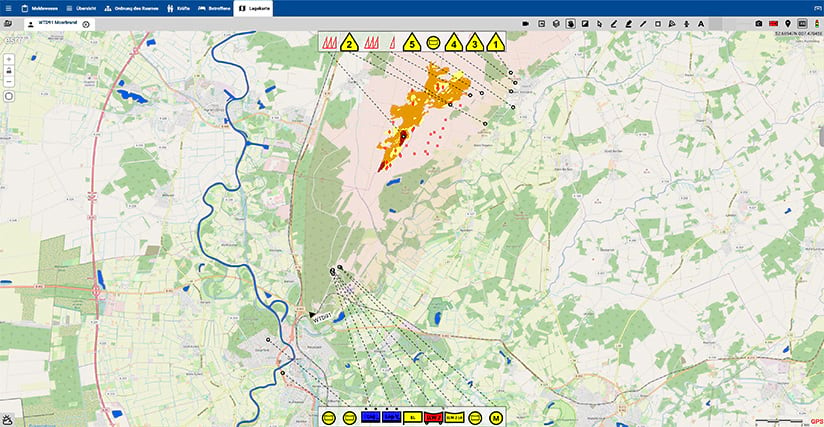
Emsland District, which encompasses Meppen, has a technical command group that can trigger a rapid deployment of emergency personnel using CommandX from Eurocommand GmbH. Not long after the fire started, that’s exactly what the district did, alerting the 22 fire departments and several Red Cross units in its jurisdiction about the emergency. While several of them got response efforts under way in conjunction with the Joint Information and Situation Center of Germany’s Federal Office of Civil Protection and Disaster Assistance, Eurocommand notified Esri’s Disaster Response Program (DRP), which provided additional support.
As part of the DRP, Eurocommand sent three staff members from its headquarters in Hamburg to Meppen. To ensure that everyone had access to all the same data, they brought with them Eurocommand’s operational support system, 10 notebook computers, one mobile server, and two large-format displays. It took them just under four hours to get there and less than 30 minuets to set everything up in the command center. By that point, the wildfire had burned eight square kilometers, so tracking it, managing the response, and collaborating on its status—quickly—were critical.
CommandX communicates with ArcGIS Server and Portal for ArcGIS (both components of ArcGIS Enterprise), which enables users to share data rapidly and securely—within their organizations’ own infrastructure and behind firewalls. The 64-bit system’s bidirectional interface with ArcGIS provides users with live access to basemaps, layers, and data so personnel at all levels and within each partner organization can see the most current situational and planning information on a map. Using CommandX’s networked connection, all stakeholders were able to get a realistic picture of the on-site situation without everyone having to be on the ground.
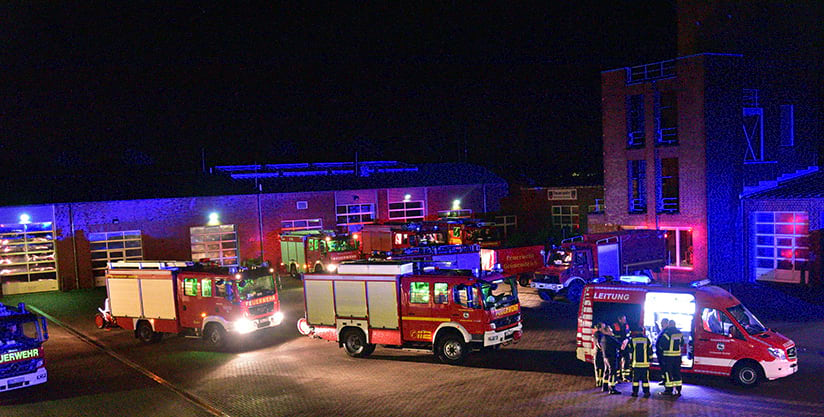
With the emergency response under way, various technical commands from Lower Saxony and the operational headquarters for the fire brigade used the software to keep tabs on ongoing operations. CommandX seamlessly integrated the most up-to-date data—including a task and notification system, a mission diary, a staging organogram, and an interactive tactical map—which made shift changeovers easier.
The wildfire ended up burning for several weeks. But thanks to the coordinated interagency effort facilitated by CommandX, the fire stayed under control. All the threatened towns were saved, and there was no damage outside WTD 91.
Everyone involved in the response effort concluded that with CommandX, it’s possible to work thoroughly and transparently and not lose data as it moves between different levels of command and among partner organizations. It also works both centrally and locally without experiencing any outages or interruptions, which is paramount during an emergency that requires networked command support.
Visualizing Complex Asset Data, Simply
St. Johns County (SJC) Utilities in Florida is no stranger to GIS. The organization has been using ArcGIS technology since 1997 and the Cityworks-Azteca Systems asset management platform since 2008. Over the past decade, SJC Utilities has evolved from simply using GIS to track and display historical asset data to employing mobile GIS and real-time data visualizations to manage operations and planning.
To help with this ongoing transition, SJC Utilities worked with Cityworks staff to connect its asset management data to Insights for ArcGIS, Esri’s data analytics software that distills complex information into simple visualizations. Using Cityworks and Insights for ArcGIS together would allow SJC Utilities to track its assets and their associated labor, costs, and materials using eye-catching maps, charts, and tables.
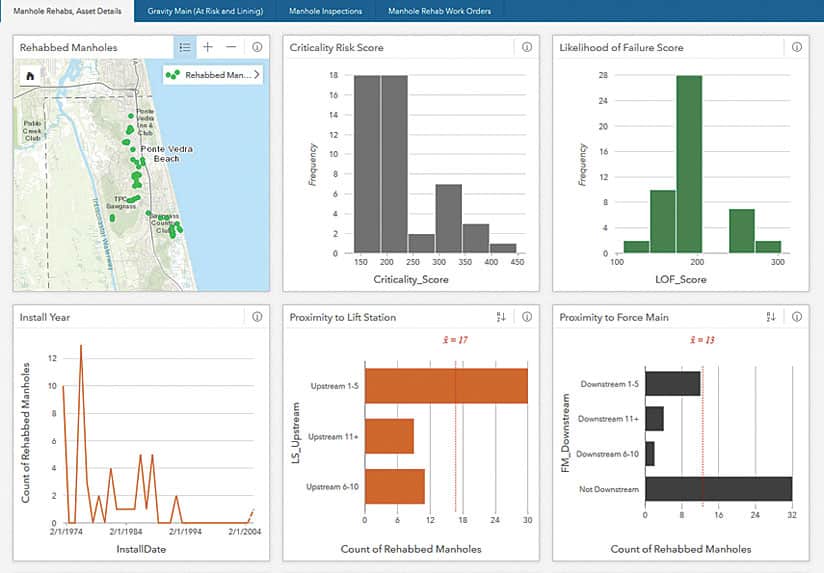
Supervisors and staff quickly connected with this dynamic method for informing business decisions. A group from SJC Utilities’ engineering, operations, and finance teams, for example, used the solution to analyze their manhole, sewer main, and capital rehabilitation projects. The data discovery and analysis helped them shift rehabilitation funding to the areas of greatest need. The warehouse and purchasing division is also using an Insights for ArcGIS workbook that pulls data from the Cityworks material velocity analysis to review stock quantities, identify material purchase demands, and set minimum stock-on-hand levels.
“With Insights for ArcGIS, we can transform our Cityworks data into shareable knowledge and live visuals, promoting awareness and understanding of our projects among all staff,” said James Galley, a senior financial analyst at SJC Utilities.
By using Cityworks and Insights for ArcGIS, SJC Utilities reduced the time it takes to build analyses by approximately 60 percent. Instead of having to use flat reports, the organization now has access to live mobile analytical tools. The sophisticated levels of analysis and flexible data navigation support better data-driven decisions both in the short term and with long-term planning.
