Over the course of the last year, most technology, research, and analytics companies around the world turned their attention to helping stem the tide of COVID-19. Geospark Analytics, based in Herndon, Virginia, did the same, but with a focus on AI.
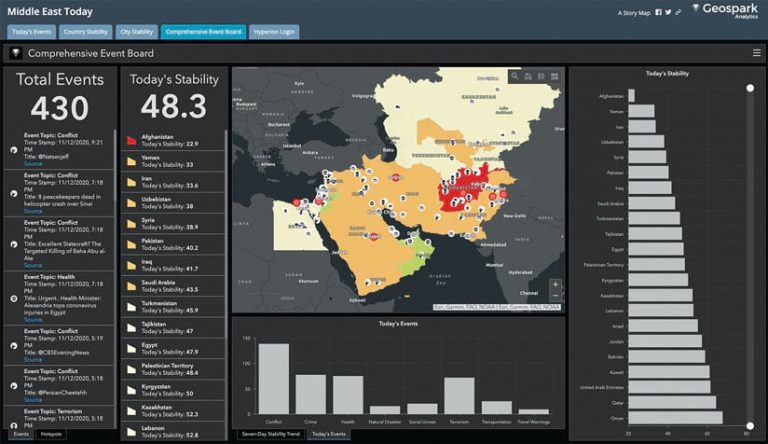
In April 2020, a number of federal and military organizations in the United States contacted Geospark Analytics to inquire whether its AI algorithms could be used to assess the impact of COVID-19 on the US health-care system. To see, Geospark Analytics turned to its Hyperion AI engine—specifically, the Health Events model—and began identifying, tracking, and analyzing COVID-19 events. The data in this model includes information from news sources and social media.
The team at Geospark Analytics employed a combination of the Hyperion platform’s API and ArcGIS Online to develop streaming feature services that it released to the public through Esri’s COVID-19 GIS Hub. It also developed a dashboard to track global COVID-19 reporting. Armed with this information, the organizations that originally were contacted by Geospark Analytics have been able to assess the virus’s effects on local hospital systems and better focus their relief efforts.
After conducting this initial project, Geospark Analytics fine-tuned its Hyperion AI engine to produce a county-level, seven-day forecast of the potential impacts of COVID-19.
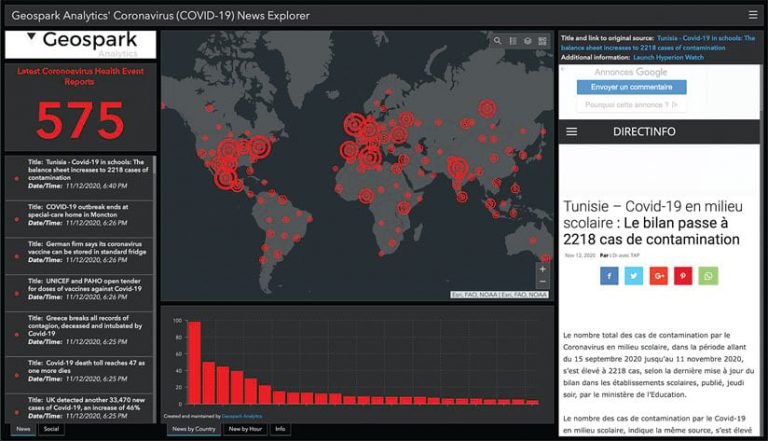
The model accounts for factors such as a county’s total population; population density; the number of at-risk people; the availability of intensive care unit (ICU) beds; stresses on local hospitals and ICU systems; and confirmed COVID-19 cases, deaths, and recovery rates. These AI models are available to first responder organizations as feature layers and as a series of Esri technology-based dashboards. The layers and the dashboards have been accessed more than four million times.
“These assessments are not just dots on a map,” said Geospark Analytics COO John Goolgasian. “This is actionable information.”
In expanding its work on COVID-19, Geospark Analytics has integrated its data, three of the AI models on the Hyperion platform (Events, Hotspots, and Pulse), and its ArcGIS Online feature layers into other environments. This is allowing its federal and defense clients to better assess other issues, too, ranging from hurricane response to transnational organized crime.
Developing a Long-Term Shoreline Resilience Plan
In Chicago, Illinois, the lakefront along Lake Michigan—which is composed of approximately 26 miles of shoreline—is dedicated almost entirely to public recreation, with 18 miles of trails and 29 beaches. Recent historically high lake levels and the potential for repetitive severe storm damage, however, have presented a unique set of risks for this city jewel.

The Chicago Park District, which owns, maintains, and manages the majority of the lakefront, is developing a long-term plan to help guide investment in lakefront repair and maintenance and increase the area’s resilience. What’s more, it is hoping to parlay this into future partnerships with other agencies.
To help implement the plan, the park district worked with Urban GIS and shoreline engineering expert SmithGroup.
First, the team prepared a GIS inventory and condition assessment of the shoreline’s protection features. Then it built a GIS repository of shoreline parcels and park boundaries, plus adjacent land-use information. The team leveraged ArcGIS Pro to perform various spatial analyses that showed decision-makers all the park district’s assets, along with their conditions, relative distances, and priority indexes. The project team was also able to incorporate and digitize historical jurisdictional and infrastructure information from raster data sources going back to the 1800s.
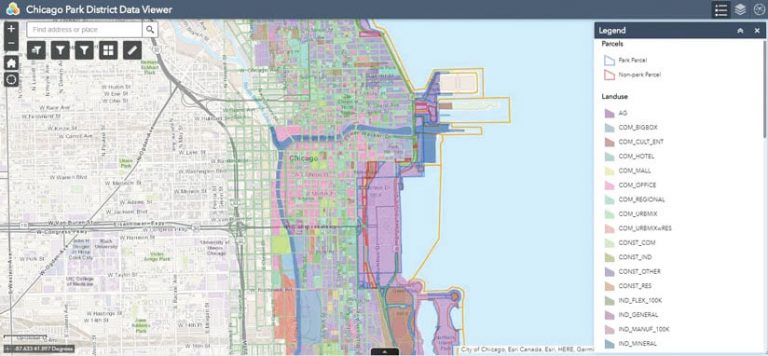
From there, the team configured an internal ArcGIS Online site to enable decision-makers to visualize and query data in a dynamic, user-friendly interface. This allows city planners, engineers, and attorneys to analyze complex operational, programmatic, and land-use questions through spatially enabled decision tools and dashboards. The team also set up an ArcGIS Urban model to perform ongoing analyses of capital improvement and proposed development scenarios.
As a result of this project, the park district was able to address some of the higher-risk portions of the lakefront by adding significant parkland, creating new recreational opportunities and amenities, and enhancing ecological resources. With the city’s new tools and augmented location intelligence, the Chicago Park District has entered a new era of operational efficiency and effectiveness.
A Water District Upgrades Its GIS—and None Too Soon
Hallowell Water District (HWD), established in 1921, provides water to the city of Hallowell, Maine. To meet the needs of 884 residents, 109 businesses, and 17 government agencies, the district uses between 200,000 and 250,000 gallons of water per day.
While HWD had a legacy GIS technology implementation—ArcGIS Desktop 10.3—the district didn’t use it very frequently. It wasn’t set up to meet HWD’s current needs, including sharing data across agencies. So HWD set out to bring its GIS up-to-date.

To get this process started, neighboring Gardiner Water District introduced HWD superintendent Zach Lovely to Honey Badger Analytics in 2019. As a first step, Honey Badger Analytics conducted a quick capability review of HWD’s systems and discovered that the water district was using less than 10 percent of what its GIS and data had to offer. From there, the goals were to bring HWD’s GIS up to current standards, improve the district’s overall experience with GIS, and give HWD access to the features and results it needed.
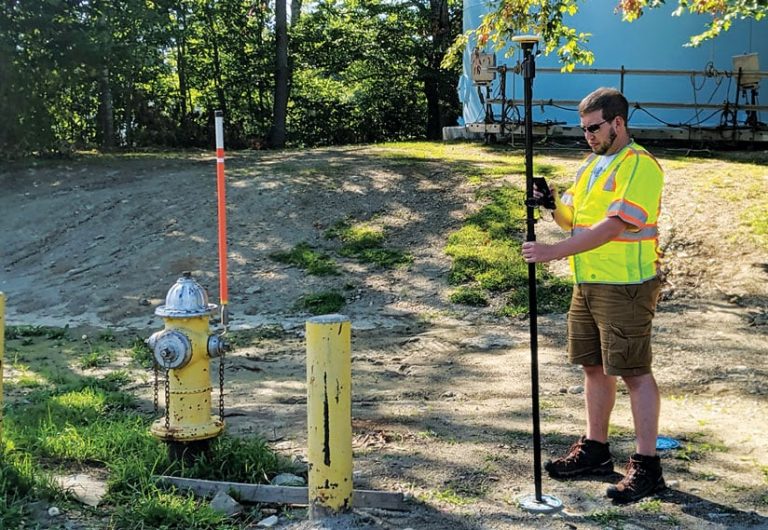
Honey Badger Analytics implemented ArcGIS Pro and ArcGIS Online as the foundation of HWD’s new system. By migrating the district’s prior work in ArcGIS Desktop 10.3 to ArcGIS Pro and ArcGIS Online, Honey Badger Analytics made HWD’s GIS accessible from anywhere. The Esri partner also used ArcGIS Hub to update HWD’s web pages, implemented ArcGIS Collector for data collection, and deployed two additional ArcGIS solutions for reporting leaks and making notes on maps.
For HWD, Collector has made gathering and updating data simple, efficient, and effective. The cost savings alone of being able to collect and maintain data in the field, instead of doing annual data updates, is significant: the water district estimates that it has saved more than $10,000 annually in these operations. Enabling HWD’s only mobile worker to use the app right on his phone costs just about 33 cents per hour. What’s more, he has access to the app 24 hours a day instead just during his 8-hour workday, which is helpful for emergencies.
In addition to improving processes and saving on costs, HWD’s new ArcGIS implementation has resulted in other, unforeseen returns on investment (ROIs). For example, not two weeks after the new system was up and running, there was a large house fire in HWD’s area of responsibility that led to the blowout of a 12 -inch water main close to the supply tank. Within 10 minutes, Lovely was able to use Collector to get the affected water valves closed. If this had occurred prior to the implementation, Lovely would have had to go to the office (a 20-minute drive one way) to find the location of the valves, an in-line pump would have been lost, water from the hydrants wouldn’t have been available to fight the fire, and customers within range of the supply tank would have experienced disrupted water service for a significant amount of time.
Another unforeseen benefit of modernizing HWD’s ArcGIS implementation is that the district can now share data with its sister district in Gardiner. Now, when the two organizations work together on projects or if one of them needs extra coverage, the teams can view assets for both districts and communicate immediately. So two water districts can work together as one, even though they’re each using their own ArcGIS Online setups.
For his part, Lovely is glad to have an efficient and effective GIS at HWD—and is happy to be setting the pace on finally using it.
