The US Department of Housing and Urban Development (HUD) has a mission to build durable, inclusive communities and provide quality homes for low-income families and individuals. In pursuit of these objectives, HUD collaborates with communities across the United States to establish job-generating economic development projects.
To meet high demand for information about these projects and make its data easily accessible, HUD works with Esri partner VSolvit to develop and maintain an enterprise GIS (eGIS). Building on the data it houses in ArcGIS Server, HUD can easily manage this data, generate intelligent maps, and create interactive web apps and dashboards.
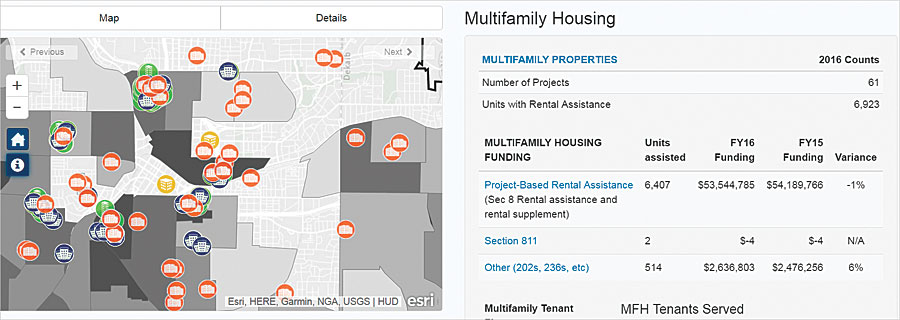
Members of Congress often request reports from HUD to see how the department’s money flows through their districts and to check up on local HUD projects. Recently, HUD launched the Community Assessment Reporting Tool (CART) to answer the frequently asked question, How is HUD investing in my community? Using any device, representatives’ staff members can simply go to CART, type the name of a location into the GIS web app, and see the housing funds allotted to that community, the dollars spent on rental assistance, information on mortgage insurance programs and other insurance-related data, community development blocks, poverty levels, and more.
From Hours, Days, or Weeks to Now
Before HUD launched CART, the department’s staff spent many tedious hours manually creating reports. If a member of Congress asked to see entitlements in his or her district, a HUD field analyst would begin the process by asking local communities’ planning and development offices for data on area HUD investments. Then, the analyst would pull up two additional data layers—one that showed the area of the entitlement jurisdiction and another that showed the congressional district—on a map to see where the two intersected. The analyst would populate that area with the entitlement data and, finally, send the map to the requester. This process usually took hours or days—and sometimes even weeks.

Now, CART does all the work. Built with ArcGIS API for JavaScript, it automatically compiles the agency’s program investments at five geographic levels: city, county, state, metropolitan statistical area (MSA), and congressional district. Drawing on the most recent data, the CART web app displays the information in a dashboard with a map, a chart, and a table. Users can jump from tab to tab to view the different ways HUD invests in a community.
And CART isn’t only a tool for congressional staff. It is public facing as well, accessible via HUD’s eGIS Storefront, a portal that makes the agency’s authoritative datasets available and easy to find and that also houses all the department’s external and internal apps.
Citizens can use CART to see how much funding is available for projects in their neighborhoods, find out the occupancy of a specific public housing project, discover which HUD funds are available to their communities, and look up HUD investments based on congressional district. With access to this information, citizens can better engage with their representatives on matters that concern them and their neighborhoods.
What’s more, CART is available to each of HUD’s 18 program offices and 64 field and regional offices. This enables staff at any location to access HUD’s eGIS information and answer questions for stakeholders on behalf of the agency.
Consistent Data, Future Development
CART takes data from different sources, people, and agencies, such as the US Census Bureau, the American Community Survey, nongovernmental organizations, federal employees, and contractors. It also draws data from HUD’s internal systems, such as the Inventory Management System, the Tenant Rental Assistance Certification System, and the Homelessness Data Exchange. Data providers update their contributed data quarterly, annually, or simply as needed.
The eGIS program team conditions this varying administrative data by geocoding it with time and space features. To ensure that map outputs and reports are consistent, all data must comply with HUD’s standards. These requirements ensure that the data in CART is accessible and compatible with other data so that users can generate accurate analyses.
To make CART even more useful, the team is exploring new avenues for the app, such as how to summarize and visualize HUD program data for other geographic levels. Adding American Indian and Alaska Native jurisdictions, for example, would help people understand how HUD is investing in tribal communities.
Additionally, in giving demonstrations of CART to congressional staff, HUD employees have had the opportunity to think more broadly about how other enterprise-wide GIS apps could benefit the agency and its constituents. One possibility is disaster support. After a natural disaster such as a flood, various agencies and people want to know what HUD investments are in the affected area and which assets were damaged. Disaster recovery managers, for example, could use the analysis capabilities of eGIS to answer these basic questions, inform decision-makers about the situation, and help victims get back on their feet.
Satisfying Stakeholders and Meeting Citizens’ Needs
With CART, HUD can deliver better intelligence to all stakeholders and manage its funding more efficiently. HUD is now meeting Congress’s need for information in an easy-to-understand format that is useful for allocating housing allowances, evaluating community needs, and communicating with citizens.

