Department of Transportation Cleans Tagging Off 76 Highway Signs in 35 Days
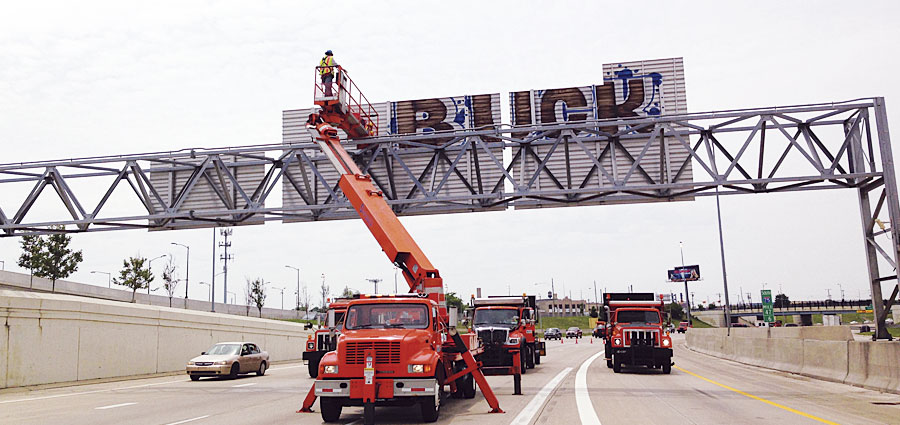
A few years ago, Detroit faced a challenge familiar to many metro areas: a rise in unwanted graffiti on public infrastructure. The Michigan Department of Transportation (MDOT) also noticed that new graffiti was appearing in more precarious spots. Instead of marking up typical roadside assets—such as abutment walls, concrete and steel bridge beams, and gas stations—taggers were spray painting signs that hung 15 feet in the air, usually above moving traffic.

At the peak of the problem, more than 90 overhead signs were tagged along the metro Detroit freeways, creating distracting and unsafe driving conditions. Citizen complaints increased, as did political pressure to get rid of the graffiti. MDOT maintenance crews needed to find a way to efficiently clean the signs—especially the ones affixed to bridges and trusses over roadways with high volumes of traffic.
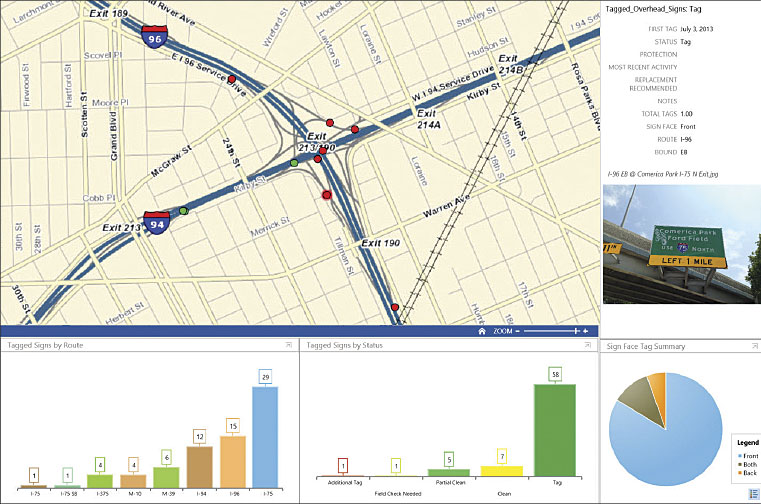
While MDOT’s metro Detroit office was trying to figure out how to remove this graffiti, the department’s central GIS team was testing ArcGIS Online and Collector for ArcGIS. Since the metro Detroit office needed to locate all the tagged signs and carefully plan cleaning operations so as not to completely disturb traffic, the central GIS team decided this would be an ideal pilot project for trying out the two ArcGIS programs.
The overarching goal was to get the tagged signs cleaned. But the ArcGIS Online Graffiti Pilot project had three additional objectives:
- Streamline cleaning efforts across the five offices and maintenance garages that were involved in graffiti removal.
- Develop a reporting tool that showed the operation’s progress to MDOT management and outside agencies, such as the City of Detroit, police departments, and the media.
- Gain experience using innovative technology like ArcGIS Online and Collector.
It took the central GIS team six months to build the foundation for the project—developing data schemas, writing training guides for how to use Collector, and configuring the app.
In the summer of 2014, MDOT maintenance staff began gathering data using Collector on their iOS phones and tablets. Every place they saw a tagged sign, they would record the location, note the sign’s basic attributes—for example, its route direction (eastbound, northbound, etc.), which side of the sign the graffiti was on, its status in the project (tagged, clean, retagged), and the date of the most recent activity on the sign—and take a photo.
This first inventory of Detroit’s freeway signs helped create the initial dataset. Following that, MDOT staff collected information about other tagged signs on a more ad hoc basis, photographing and logging new graffiti locations while they were riding in a car or updating the database when citizens called in with fresh complaints.
The mobile data collection was invaluable. Having a photo accompany the location data for the signs allowed the team to plan each cleaning. Knowing the extent of the graffiti and the lanes over which it occurred helped MDOT figure out how much of the road to close during the cleaning and for how long, as well as the amount of cleaning supplies that would be needed.
The team also incorporated MDOT’s live lane closure service (from its 511 site) into the app. This enabled cleaning crews to track down planned lane closures so they could complete their graffiti cleaning at the same time that other roadwork was being done.

Using ArcGIS Online and Collector allowed the maintenance team to be much more organized, especially since the work was being done by offices and garages that don’t normally communicate with each other. The technology helped everyone get on the same page by using common data formats and got people to speak the same language.
“Having the graffiti information and photos in the online map was critical for us to be able to efficiently and accurately report [the] status of the cleaning work to our stakeholders throughout the cleaning process,” said Tony Kratofil, the metro region administrator for MDOT.
This project also made the graffiti issue universal to the region rather than a problem each branch had to deal with solo. That’s in part because upper management at MDOT monitored the cleaning project through Operations Dashboard for ArcGIS. And when local and state law enforcement learned about the project, they partnered with MDOT to share data about the taggings. MDOT gave the agencies information on the locations of the tagged signs and the dates they were recorded, as well as the photos, to aid in the apprehension and prosecution of taggers.
Although cleaning the graffiti off all the signs seemed insurmountable at the outset, it only took MDOT 35 cleaning days to clear up 76 signs.
As the project progressed, fewer and fewer signs were being tagged. So the pilot project unofficially ended in early 2015. The data that was collected, however, is still valuable for MDOT maintenance staff today, and the department still uses Collector.
In fact, shortly after the completion of the tagging project, MDOT used the data to manage and install climbing deterrents on trusses. It also used the same methodology to replace 30 of the signs that were too badly defaced by graffiti to clean up.
Additionally, the pilot project initiated a new way for MDOT to contract out graffiti cleaning. In the past, MDOT identified the location of the graffiti, got a vendor out to clean it, inspected the cleaning, and paid the vendor. But with the new GIS-based system, MDOT started a graffiti cleaning contract for the region in which a vendor monitors and cleans graffiti on its own using the ArcGIS technology MDOT developed during the pilot. MDOT posts new graffiti locations in ArcGIS Online and uses Dashboard for ArcGIS to ensure that the vendor is cleaning tags effectively.
This new contract is a testament to the success of the central GIS team’s pilot project with ArcGIS Online and Collector. Using Esri technology, MDOT found an innovative solution to Detroit’s rising graffiti problem and overcame it—just like any smart community could do.
About the Authors
Matt Robinson is a transportation planner with MDOT’s central GIS team. Joe Bartus is a senior transportation engineer with the metro Detroit division of MDOT. For more information, email Robinson or Bartus.

