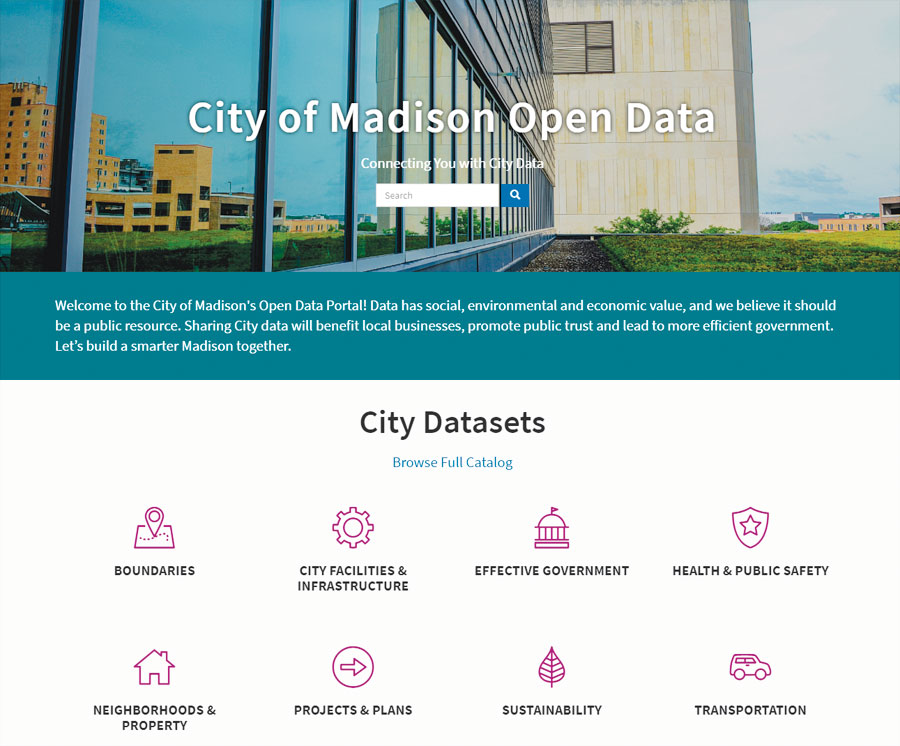
Madison, Wisconsin, recently made its open data site more user-friendly for city residents and staff alike. The refresh of its original site, built in 2012, turns what was a simple data repository into a robust open government resource. The effort was driven in part by Madison’s inclusion in Bloomberg Philanthropies’ What Works Cities, an initiative that is helping 100 midsize American cities amplify how they use data to refine services, engage residents, and better inform local decision-making.

Through its City of Madison Open Data site, the city puts data into the geographic context of a map, making it easier for everyone to find and interpret information. The site is organized around important issues such as budgets, boundaries, facilities, projects, and plans. Madison’s open data portal also serves developers, who can access raw data to build apps for businesses, educational institutions, nonprofit organizations, and citizens.
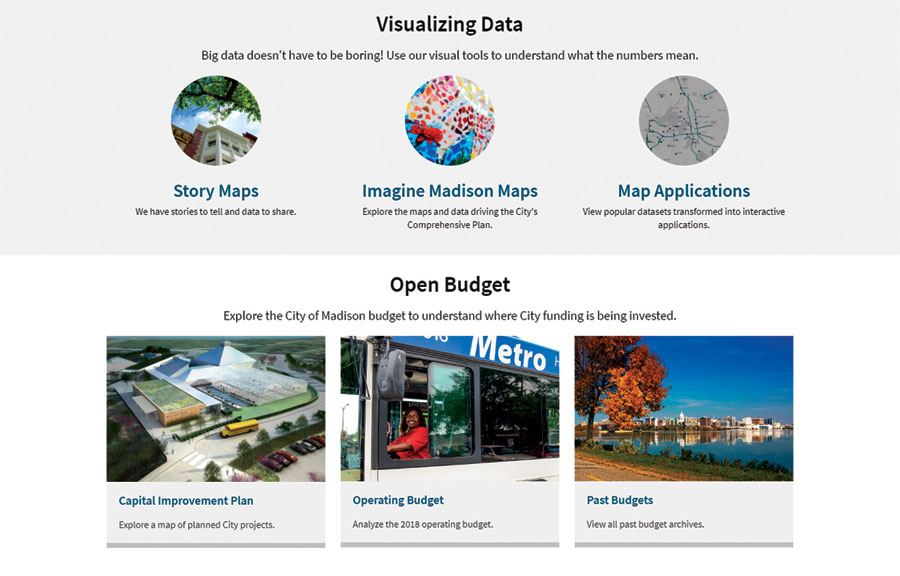
Madison uses its open data site to share tools for planning and decision-making related to sustainability, city services, and other vital issues. These tools include an option to view Neighborhood Indicators that illustrate the quality of life in various Madison neighborhoods. The site also links to Healthy Dane, a resource that provides health and population data for all of Dane County. Users can view the Active Living Index as well to find out about nearby walking, biking, and transit routes. They can also review the city’s budget to understand where funds are being invested, explore a map of planned capital improvement projects, and see how the city is adding resident feedback to its comprehensive plan.
To provide better resources to its citizens, Madison intends to use its open data site as a way to implement data collection and data management throughout the city. City staff will be able to contribute and access real-time data about city services such as public works, parks, and transportation.
For the site revamp, Madison officials decided to move away from the city’s previous, costly open data solution and build one using the ArcGIS platform, which was already deployed across the organization. Given that ArcGIS Open Data was included in Madison’s existing ArcGIS investment, the city was able to reduce costs. Additionally, the switch in software meant an upgrade from a simple data repository to a more robust open government resource.
“We wanted to see a stronger use of data among city staff and residents,” said Sarah Edgerton, web manager for the City of Madison. “We looked at where most of our data was collected, and it was mostly in ArcGIS. We realized that we should use the ArcGIS toolsets that our staff is comfortable with and that they like to use.”

Developers and designers working for the City of Madison employed ArcGIS to create apps that help put popular datasets into interactive maps. For example, the city implemented Esri Story Maps to provide a visual context for important city initiatives, such as its 2018 Capital Improvement Plan. The story map is a geospatial depiction of the city’s capital budget, which covers one-time expenses, such as infrastructure projects, and lays out construction plans for the next six years. Budget information is grouped into four general categories: facilities, transportation, parks, and utilities. Data within the maps links to the city’s project pages, which have additional information such as schedules and renderings. This level of detail helps engage the public in the budget process at an entirely different level.
Madison’s IT web team and GIS team collaborated with the city’s data coordinator for about two months to build the new open data site. Esri provided the guidance, strategy, and tools that city staff needed to do the work in-house. So far, the response from internal and external users has been positive. The city’s GIS group is excited about the new project, and developers like the look and feel of the new site. Many users report that the new categories serve as beneficial guides and that they like receiving information in the form of an Esri Story Maps app.
“Our internal customers were already using ArcGIS,” Edgerton said. “ArcGIS Open Data has such strong mapping capabilities but still allows us to use tabular data. The clerk’s office, for example, just needs to upload Excel spreadsheets with their data, whereas utilities, public works, and transportation departments are really interested in mapping. We also like that we can build applications with ArcGIS.”

After working with ArcGIS Open Data and researching various options, Madison is looking into implementing ArcGIS Hub. As a two-way engagement platform, ArcGIS Hub uses open data and communication tools to rally communities around issues and initiatives. ArcGIS Hub helps government agencies, developers, and citizens apply data to make their community a more efficient, livable, sustainable, and smart place to live.
“We are interested in using ArcGIS Hub to engage residents in our data that we are using to build a smarter Madison,” said Edgerton.
Learn more about how to take your open data even farther by connecting it directly to community priorities.

