Because of its size, big data can be difficult to store and complex to process using traditional data processing software. Rather than migrating big data to specialized computing environments, organizations typically store and analyze this data in managed clouds.
ArcGIS GeoAnalytics Engine brings the power of Esri’s spatial analytics capabilities to where organizations’ cloud-based big data lives: in data lakes, data warehouses, and databases. Supported cloud environments include Microsoft Azure Synapse Analytics, Amazon EMR, and Google Cloud Dataproc.

Data scientists and GIS analysts access GeoAnalytics Engine directly from within Apache Spark, the large-scale data processing engine that’s designed for big data analysis. This makes performing spatial analysis on big data faster and more efficient while going well beyond the basics.
Conducting Analysis Where Data Is Stored
In the past, data had to be moved to where analytics was accessible, usually in specialized analysis environments. But migrating massive data is cost prohibitive and time-consuming and creates data silos.
This is primarily why data scientists adopted Spark—an open-source analytics engine used to process large amounts of data—as their big data environment of choice. It employs cluster computing to increase big data processing speeds while hosting various libraries of analytic functions that are delivered directly to data where it is stored.
GeoAnalytics Engine is native to Spark, so it leverages Spark’s computing power while rapidly processing massive volumes of spatial data. Without GeoAnalytics Engine, processing big datasets can take hours or even days. But benchmark testing done by Esri shows that the performance of GeoAnalytics Engine is 10 to 100 times faster than other open-source spatial analysis options.
Processing 16 Billion Records in Five Minutes
Government agencies and commercial organizations often work with tens of billions of records to gain actionable intelligence from data. Cellular network coverage data, for example, is huge and can reveal a wealth of information if the right spatial analytics is applied to it.
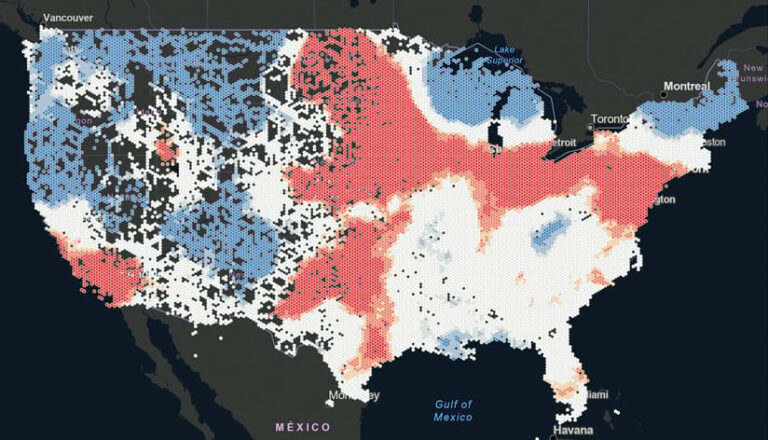
Real-world uses of anonymized cell coverage data include determining where mobile networks have satisfactory or unsatisfactory coverage and finding out how many people lingered at a specific site for a particular amount of time. Cell Analytics, from Esri partner Ookla, collects big data on how cell networks around the world are performing each day. Taking a dataset of about 16 billion depersonalized records from Cell Analytics (the cellular coverage dataset from Speedtest), a team of data scientists at Esri used the Find Hot Spots and Find Dwell Locations tools in GeoAnalytics Engine to identify patterns of cell signal strength and human presence and mobility. It took the team less than five minutes to extract, transform, load, and analyze 16 billion records. The team was then able to quickly build interactive dashboards, web and mobile apps, map-based stories, and analytical models to share actionable information with stakeholders.
In this scenario, if the data scientists had used traditional spatial analysis packages, they would have needed to geospatially index the data, which takes a significant amount of time. GeoAnalytics Engine enables users to skip that step and employ geospatial data immediately, streamlining the process of getting from raw data to actionable results.
This means that data analysis can begin right away. Users are able to focus on supporting the mission at hand rather than losing valuable time on moving and preparing data. And once generated, analysis results are easy to communicate so that stakeholders can act.

Seeing the Full Picture
GeoAnalytics Engine enables users to create comprehensive analyses of specific situations. It has a library of more than 120 functions and analysis tools—ranging from simple transformation and spatial aggregation tools to advanced statistical algorithms that aren’t available in open-source packages—in a standard big data analysis workflow. Thus, data scientists and GIS analysts no longer have to patch together spatial analysis packages to get the full picture of a situation.
To conduct a full-picture analysis with GeoAnalytics Engine, data scientists at Esri obtained public information from the City of New York’s open data website to see where noise complaints occur in high numbers. City officials could use the results of an analysis like this to identify where more noise-tampering resources need to be deployed.
In New York, residents can call or send a message to the city’s 311 customer service center to make noise complaints (and access other nonemergency city services). The Esri team obtained 27 million noise complaint records for a 10-year period to perform the analysis.
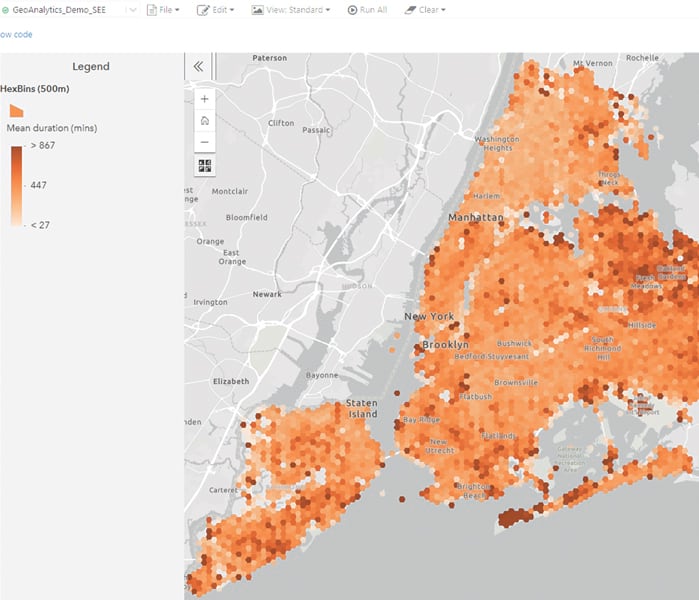
If team members had relied on traditional analytics to try to answer their primary question, they could have used the 311 data to determine whether noise complaints had increased, decreased, or stayed the same, but it would have been much more difficult to find out where and when the complaints had occurred and how long it had taken to respond to them. That’s where spatial analysis comes in. Using GeoAnalytics Engine to process the data, the team generated a hexbin map to show clusters of 311 noise complaints along with their corresponding response times. Darker bins on the map reveal areas where it took longer for city officials to respond to noise complaints, suggesting less efficient 311 service.
Continuing to Evolve Big Data Spatial Analytics
As organizations obtain ever-larger volumes of spatial data that need to be processed and analyzed, the capabilities of GeoAnalytics Engine will only continue to grow. Future releases will focus on adding tools and functions, advancing how data comes into and is shared out of GeoAnalytics Engine, and enhancing visualization capabilities.

