Communities need quality information to thrive. They also need a way to analyze and understand the world around them, especially information and data that impact their daily lives.
As publisher of the Black Voice News, a 48-year-old weekly newspaper based in Southern California, I launched Mapping Black California (MBC) in 2017 to better understand, report on, and visualize data on Black Californians. The initiative combines the advocacy journalism legacy of the Black press and the data visualization capabilities of geospatial technology to enhance community news and storytelling.
My interest in GIS started after my staff at Black Voice News used Esri’s ArcGIS technology to map the Black Voice Foundation’s Footsteps to Freedom Underground Railroad study tour, a trip for educators to teach them about 19th-century freedom seekers and cultivate learning through empathy. The map was simple: it traced the route of our eight-day trip from Kentucky to Canada and included photos, site descriptions, and historical information. A few months later, the same team created a map narrative for a California Coastal Commission grant documenting the history of the segregated beaches that used to dot California’s coastline.
When I later met Esri president Jack Dangermond, I mentioned my growing interest in geojournalism. Since Black Voice News is a community newspaper, I thought our work needed to maintain a focus on our immediate community. But my idea expanded after Dangermond invited me to the Esri campus in Redlands, California, to witness one of his favorite events: annual presentations made by high school students who have used ArcGIS technology to better understand complex problems in their communities and explore possible solutions. I left the campus inspired. That inspiration led to the Mapping Black California idea.

Structured within a community mapping framework, MBC promotes the value of GIS and encourages community collaboration around data and information by bringing together community media, community-based organizations, and educational institutions. The team at MBC—led by project manager Candice Mays, who has a background in the humanities and education; digital cartographer and designer Chuck Bibbs; and writer/editor Stephanie Williams—was joined in 2019 by archivist and information management consultant Bergis Jules, communications strategist Marla Matime, and researcher Dr. Anthony Jerry. The goal by that time was to expand MBC’s work as part of the State of California’s historic 2020 Census and media communications effort.
As a team, we saw this work as an opportunity to truly turn our community mapping project into a hub of census information and data. In February 2020, we launched the MBC Census Lab with 400 community-based organizations and 32 media partners that worked collectively on census reporting and community engagement with the goal of getting a complete count.
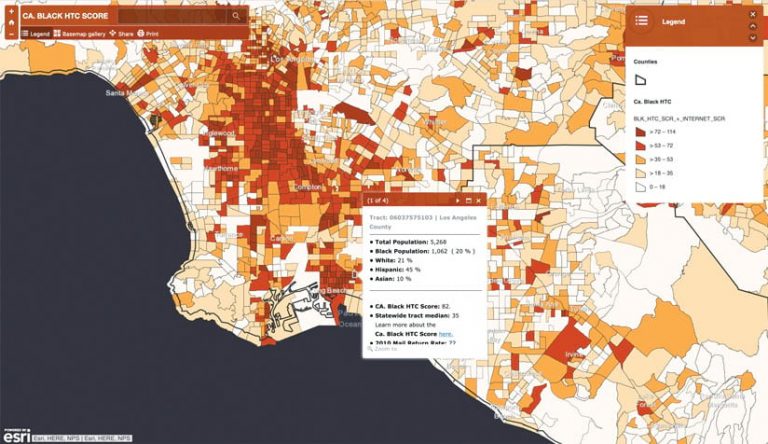
As part of this effort, our team built a hard-to-count map to more effectively target Black populations in California that are difficult to count with relevant messaging that would inform and educate them about the census and motivate them to participate. Following the lead of the California Census Office’s interactive Hard-to-Count map, which takes into account indicators that historically correlate with undercounts and are associated with new barriers to enumeration, our map is based on multiple demographic, housing, and socioeconomic variables that show where it’s typically difficult to enumerate the Black population. Of California’s 8,057 census tracts, those with higher hard-to-count scores are areas that posed significant challenges to the 2020 enumeration, while tracts with lower scores were potentially easier to count.
Armed with the hard-to-count data, we led community meetings and held focus groups to assess Black Californians’ gaps in knowledge about the census and discuss what would drive them to participate. We then used this information to create culturally relevant messages for our Black media partners to share with local communities.
Together with Esri, we held a four-hour training on ArcGIS Online and a one-hour ArcGIS StoryMaps workshop for other Black community news publishers in California. MBC and Esri also jointly hosted a briefing from the national Mapping the Count initiative—a broad-based coalition of racial equity organizations, including the National Association for the Advancement of Colored People (NAACP) and the National Urban League—for Black journalists and publishers to further support our shared goal of getting a complete count of all communities of color. The briefing exposed media outlets to the GIS tools the coalition used to identify; reach; and, ultimately, count the hardest-to-count populations across the country. In addition, MBC facilitated a partnership between the Mapping the Count coalition and Esri, leading to the donation of more than 1,300 free ArcGIS Online licenses to grassroots organizations around the United States that were working to get a full census count.
Another important aspect of our community mapping project is working with strategic community-based organizations that are dedicated to educating and training the next generation of community leaders and strategic thinkers by introducing them to geospatial technology. For example, the team at the C3 Initiative, led by founder Kevin Carrington, has incorporated geospatial technology into its comic book-themed coding camps, which have introduced GIS to approximately 300 Black youth. And then there is Ignite Leadership Academy, where middle and high school-aged girls are introduced to GIS as a tool they can use to learn about the environment, business, civics, and history, as well as to tell their own stories. The academy’s founder, Shirley Coates, works with GeoMentors who dedicate 10 weeks of their time to teach the technology to young women of color.
One of our goals for the future is to continue introducing GIS technology to Black media and, through the community mapping framework, engage and empower the Black community around important data that significantly impacts their lives. We also want to assist our publishing partners with revenue strategies that underwrite the vital journalism they produce.
And, as we all know, maps need data. But a huge challenge has been having access to data that’s disaggregated by race. In many cases, we are learning, California is data blind. One of our next projects at MBC is to build a data hub that complements our mapping work and community news reporting efforts. This hub will be a data access and content discovery platform and will allow us to create more maps much quicker.
As the community media sector, we are tasked with providing crucial, accountable, and independent information to our communities. And as a community mapping initiative, MBC exemplifies how spatial data and location intelligence can serve as the basis for the types of understanding that precede action.
We believe that community leaders can use this information and data to increase their knowledge about specific issues; journalists can use it to shape social and cultural views and inform the public; and students and scholars in academic institutions can employ it to support learning, teaching, and research projects.


