Public utilities typically have sprawling work crews, administrators, and IT staff, all working to provide customers with power, access to clean water, and other services. By necessity, many of these entities have robust GIS infrastructure—from ArcGIS Online organizational accounts and dashboards that allow utilities staff to track projects and maintenance, to an ArcGIS Enterprise framework holding it all together.
Key to keeping all this infrastructure running efficiently is software such as ArcGIS Monitor. Monitor tracks the status, system performance, and resource usage of an ArcGIS Enterprise deployment, allowing an administrator or manager to optimize the health and efficacy of back-end tasks. Although most end-user utilities’ customers will never explicitly see this software operating, it has the potential to make life much easier for GIS and IT staff.

Two utilities in Minnesota—Rochester Public Utilities (RPU) and Moorhead Public Service (MPS)—have incorporated Monitor effectively into their day-to-day activities. It has proved instrumental in streamlining the operations of their GIS and IT departments.
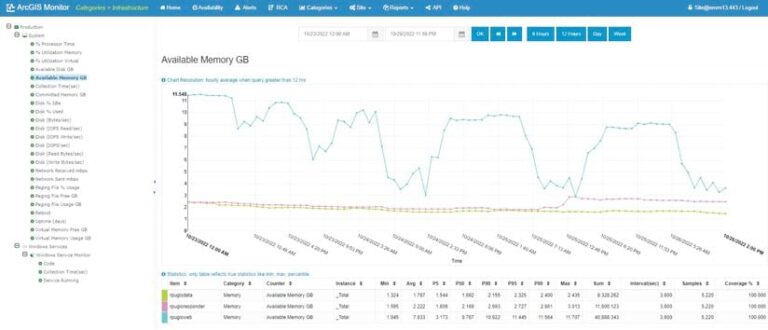
“We’re using ArcGIS Monitor for identifying infrastructure performance issues as well as [deployments] like our ArcGIS Server,” said Ryan Moore, GIS manager at RPU. “We’re also monitoring the status of our outage management service. If that service goes down, we’ll get an email alert.”
By quickly alerting RPU of GIS application and infrastructure problems, Monitor helps the GIS department keep performance up and helps RPU stay on top of service issues—and ahead of customers reporting these problems.
MPS, on the other hand, typically uses past performance metrics to identify and mitigate issues.
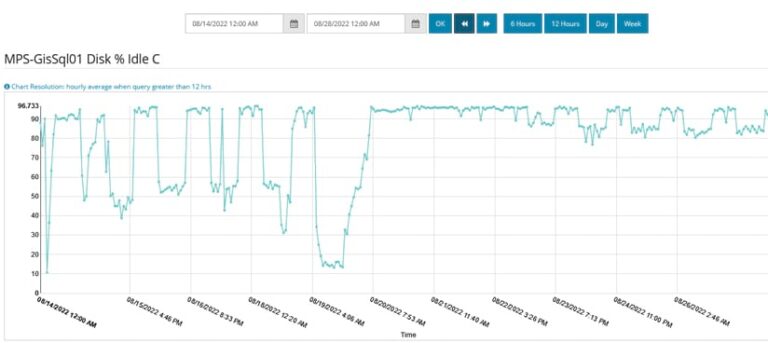
“Once something does happen, we can look at ArcGIS Monitor and try to establish a baseline or a trend to look for,” said Todd Copeland, GIS coordinator for MPS. “We’re monitoring performance issues and identifying [what] within our infrastructure might be impacting that.”
In analyzing data tracked by Monitor, for example, Copeland found that system performance slowed each week around the same time, and he suspected an automated backup routine might be the cause.
“[ArcGIS Monitor allows us] to dig in a little deeper to see exactly what the cause is and if we can manage it,” he said.
Putting Data First
“We didn’t really have a good mechanism to track how things happened beforehand,” noted Copeland. “Usually, we got a phone call saying, ‘Hey, maps are down,’ or, ‘Hey, things are running kind of slow. Is there anything you can do to help performance or speed things up?’”
Though staff will still get these phone calls from time to time, Monitor has helped create a more cohesive picture of overall enterprise GIS system health, according to Copeland.
“We’re seeing if there are issues that are continually cropping up,” he said. “If we can see a trend or pattern, day over day, hour over hour, then we know there’s something potentially looming that could create downtime or affect the users long term. In the past, there was no good metric to see if there were performance issues.”

“From a GIS admin perspective, it was difficult to pinpoint where some of those problems were,” added Moore. “ArcGIS Monitor makes it easier to interpret what’s going on with your system.”
Even as they touted the ability to respond quickly to GIS outages or slow performance, both Copeland and Moore emphasized the importance of prevention when it comes to potential issues with GIS infrastructure.
“We’re always continually looking at three or four reports,” said Copeland. “[We’re] looking at our data store, our ArcGIS Server, and our SQL Server. If any of them are high usage, we’re going to see a negative impact on performance. [We want] to see if there’s a way to catch something before it gets worse.”
Monitoring the Future
As RPU and MPS have incorporated Monitor more heavily into the day-to-day operations of their GIS and IT departments, new ways to streamline tasks have cropped up. Additionally, the long collaboration between Copeland and Moore—beginning with the Mid-West Esri Utility Users Group conference in 2011—has enabled them to share useful ideas. Taking inspiration from RPU’s use of Monitor, for instance, Copeland sees the implementation of email alerts for outages and other performance issues as key in the future.
“That’s where I see real added value for us,” he said. “[This includes] having predefined benchmarks set, and—once those thresholds [are met]—sending us a notification that something might be creating a bigger problem for the users.”
In addition, the utilities have used Monitor to not only track the web apps used by field crews but also manage administrative certificates and licenses that need to be renewed.
“[Monitor] gives you a high-level countdown,” said Copeland. “You know how many days are left before your license needs to be renewed. There are half a dozen certificates out there, and they all expire at different times.”
Moore agreed that Monitor could be instrumental on the administrative side of things, noting that he would like to use long-term performance metrics over time to improve RPU’s hardware resources.
“Whether it’s RAM or CPU, [it’s] something to justify improvements in our landscape,” he said.
What’s clear is that products like ArcGIS Monitor have a variety of uses across even a single industry, all in the service of streamlining the work of GIS and IT professionals. At its heart, Monitor is a product designed to make ArcGIS Enterprise systems function more efficiently and effectively, with fewer wrenches thrown in the gears.
“It’s a good tool to identify root problems,” said Copeland. “It really helps identify potential problems quicker.”

