Honolulu Uses Geodesign to Build Case for Rail Corridor
Being on island time conveys the aura that everything is as peaceful and slow traveling as an islander in paradise. In Honolulu, the islanders can boast they do travel slowly through their paradise, but maybe not so peacefully on their roadways, since Honolulu has claimed the top spot as the worst US city for traffic. Compounding the problem, citizens have moved to suburban areas in search of affordable housing, creating urban sprawl, which increases traffic demand when traveling to urban centers for work.

For Honolulu, the effects of urban sprawl go beyond increased traffic demand and have negative impacts, such as environmental pollution, natural habitat reduction, loss of agricultural land, and even decline in human health and well-being. In an effort to help alleviate some of the traffic pressure on its roadways, the City and County of Honolulu have approved and begun construction of an elevated rail system connecting East Kapolei to Ala Moana Center. Not only will the new railway change the way citizens and tourists will travel through Honolulu, but the planning and development surrounding the rail corridor will be redefined through what is known as transit-oriented development (TOD).
Planners look to TOD as a common solution to accommodate future population growth, control urban sprawl, and decrease traffic demands on communities through the use of dense, mixed-use housing placed near transit. This creates mass-transit and walkable access to retail and amenities. This paradigm shift to TOD planned communities with medium- to high-rise development and a new feature in the landscape, the elevated rail system, can and has been met with opposition by some community members. Part of the planners’ role is to persuade the citizens of the benefits of TOD for their community through a collaborative planning process where they share information and ideas about the development. The planners must tell the story of the future of the community from both sides of the coin. To do so, planners and consultants are using more sophisticated visualization tools, which can be very effective at shifting the attitudes about new and different development in this island paradise.
To tell the story of TOD, the City and County of Honolulu turned to GIS as a primary tool within the process. The city GIS department embraced and applied the concept of geodesign—that is, incorporating geographic knowledge into design—to more effectively analyze, compare, and visualize different scenarios of TOD for the key communities affected by the new development. To build the case for TOD, the GIS team needed to support the planners’ goals to share with the public who would have safe access to rail; how changes to the zoning would visually redefine their community; and how the TOD would positively affect the community and region, preventing future urban sprawl.
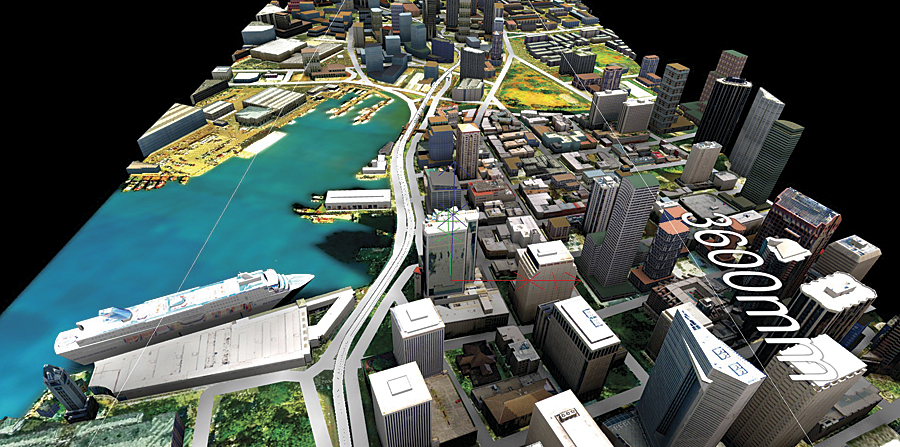
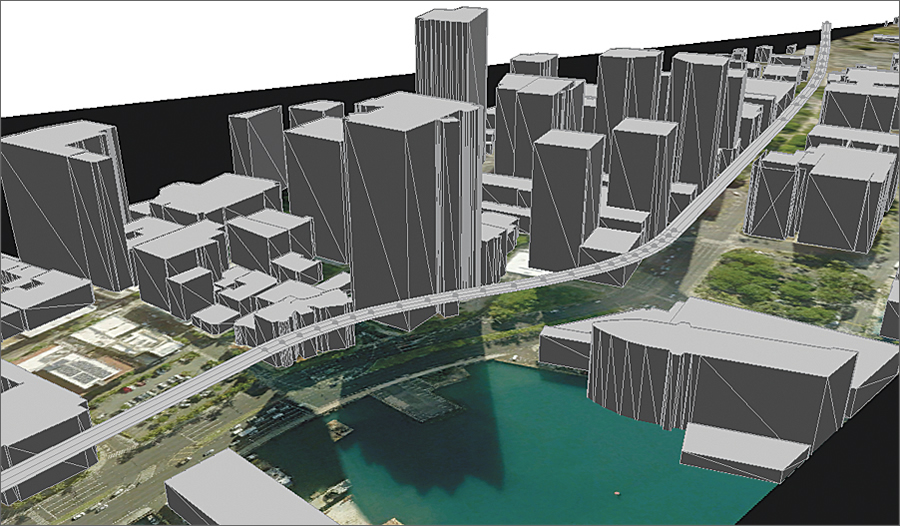
The team identified three core models that would be needed for the TOD geodesign process: walkability, urban growth, and densification models. As with any new GIS project undertaking, the GIS department first determined data resources needed to support the analysis and whether these datasets were available or needed to be developed. Most of the core data, such as roads, zoning, and buildings, was available in the rich geodatabase that Honolulu has been developing for years. Since visualization is a key component of geodesign and a powerful tool for persuasive planning support, a 3D model of the physical environment would be needed for the transit corridor. Honolulu had a good start to the city model with 3D geometries for the downtown area, including key landmark buildings with textures.

However, the model was not complete and needed to be enhanced in areas, since more than 3,000 buildings were without textures and some were mere footprints. The team used Esri CityEngine to improve the model by creating 3D geometry and applying textures based on a custom set of rules. Honolulu wanted to simulate the true look and feel of the city and accomplished this by collecting photos of real facades that were used to create a custom set of textures. These textures were applied based on the rules, instantly painting the remaining buildings. Rules were further applied to create 3D geometries by converting simple building footprints into complex structures with textures. The last component was the addition of the proposed evaluated rail, which was added from the existing engineering drawings, completing the 3D urban model of Honolulu.
The next step in the geodesign process was to analyze the effectiveness of a TOD and create alternative scenarios used by the planners to convey the benefits of TOD for a given community and the region. Utilizing the ArcGIS 3D Analyst and ArcGIS Spatial Analyst extensions and ModelBuilder, the GIS team developed reusable walkability, urban growth, and densification models in which data was run against changing variables to create different scenarios. A key factor of TOD is to provide the acceptable and safe walking or biking distance to a transit stop. The walkability model used Spatial Analyst geoprocessing tools to determine the travel distance from residences or work to a transit station.
From this analysis, stakeholders or citizens could determine the viability of transit for their use. Since the acceptance of TOD in a community must be more convincing than just ridership, the planners must convince members of the public that TOD will benefit Honolulu’s future whether they utilize the rail or not. The GIS team supported the planners by creating scenarios based on the projected future with TOD and without. The TOD plans for each station were run against the urban growth and densification models using Spatial Analyst and 3D Analyst to perform the analysis.
Using CityEngine, the rules for creating 3D geometries and texture were applied to the resultant analysis, and new models were generated representing proposed build-out of the future with TOD. The 3D model showed urban growth concentration around stations with low- to medium-density buildings and ample undeveloped land. The same models were run against the existing zoning with no TOD, resulting in a sea of houses, showing a stark comparison of Honolulu’s landscape in the future as urban sprawl. An incentive of geodesign for planners is to equip them with analytic outcomes that could be used to persuade the stakeholders and public that TOD will have a positive impact on the community. Honolulu approached the community engagement with unique visualization technologies, which included 3D holograms and simple web views of TOD scenarios. The GIS team worked with Zebra Imaging, a leading 3D visualization company and Esri Partner (Austin, Texas), to create visually captivating, true 3D views of the analysis in 3D holographic images.
Through Zebra Imaging software, ArcGIS 3D Analyst, and Esri CityEngine, the holograms were sourced directly from the exports of 3D GIS data models representing TOD and rendered to capture thousands of unique 3D views. The 3D views of the GIS were used to create a holographic grating that is recorded on film with lasers. When illuminated with an appropriate light source, what looks to be a flat piece of plastic reveals a 3D, full-parallax, color image reflected above the film’s surface.

