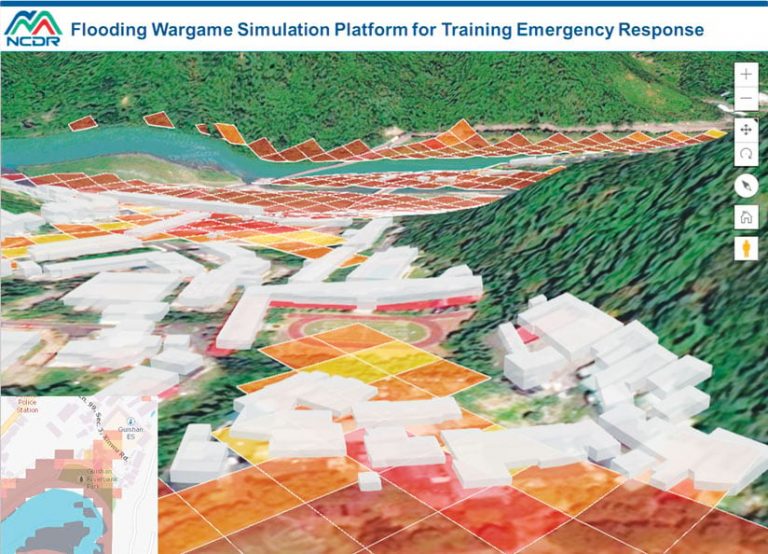
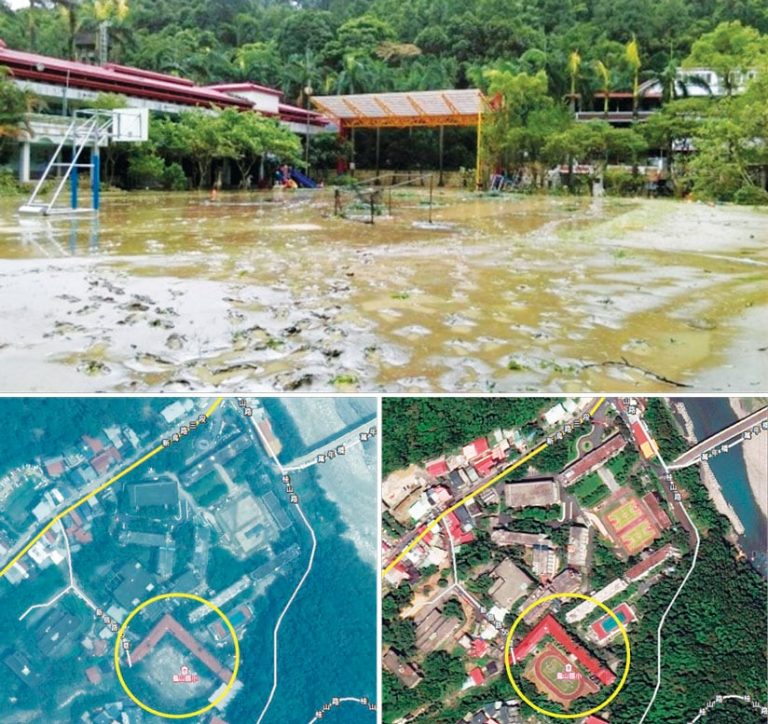
Taiwan, a 14,000-square-mile island in the Pacific Ocean about 100 miles off the coast of China, has a tropical and subtropical climate, which means it is prone to heavy rains and flooding. To help evaluate the viability of flood-based emergency response plans and procedures, the National Science and Technology Center for Disaster Reduction (NCDR) is taking a page out of the military’s playbook. Using 3D GIS, the center has put together a war game simulation for flooding.
The Flooding Wargame Simulation Platform for Training and Emergency Response is based on military battle drills, which outline how soldiers will enact specific maneuvers when they encounter certain situations. Applying this concept to flooding is designed to help officials comprehend various disaster situations and determine whether their emergency response plans and procedures—including resources deployment, evacuation support, and route planning for distributing relief supplies—are suitable for reducing the impact of a flood-based disaster. The key to these kinds of drills is to make the simulation as similar to a real disaster as possible.

To do this, NCDR worked with GIS company RiChi Technology and used ArcGIS Enterprise, ArcGIS Pro, and ArcGIS API for JavaScript to build the Flooding Wargame Simulation Platform for Training and Emergency Response. Employing 3D GIS, the platform simulates various types of flooding disasters. Now, officers at emergency operations centers (EOCs) across Taiwan’s 22 cities, counties, and special municipalities can use the platform to analyze both disaster risk and preparedness when it comes to floods.
An Optimized 3D Model Experience
The research team at NCDR and staff from RiChi Technology built the Flooding Wargame Simulation’s 3D GIS platform in two parts. They created the 3D model that processes and displays buildings and, at the same time, integrated that visualization into the platform’s functionality.
To build the 3D model, the team used ArcGIS Pro to combine building block shapes with building heights in a feature layer. For the purposes of its technical work, the team published the layer to ArcGIS Enterprise and used ArcGIS API for JavaScript to create an app that shows extruded building heights.
To accommodate the lower-performance computers used by some of NCDR’s stakeholders, the team implemented a pattern that limits the number of buildings retrieved at one time in the simulation. This helps in more condensed urban environments, for example, by adjusting the model’s performance dynamically to each specific flooding simulation. The location of the flood area is set to the center of the map, and the system only displays 3D buildings within a radius of 500 meters from this point. As users pan the map, the 3D buildings form gradually on-screen.
A Fast, Easy-to-Use Platform
In designing the platform’s functionality, NCDR’s primary focus was to make it fast and easy to use. The research team wanted to ensure that the platform could provide analysis results in just a few steps. It also wanted to present those results as thematic maps that show the flood areas, affected populations, any protected objects (e.g., vulnerable residents who would need to be escorted out of the flood area), emergency shelters, the network of disaster relief agencies, and a visualization of all this in 3D.
Indeed, the operation contains three steps: users assign a spatial analysis area, set a feasible flooding spot, and enter the flood depth. The system then calculates the lower-elevation areas around the flooding spot to show which locations would likely be affected.

The terrain data comes from a digital terrain model (DTM) with an equally spaced 20 x 20-meter grid. This amount of detail makes efficient computing difficult, though. To reduce the amount of time it takes to calculate what will happen in each section of the grid, the DTM is separated into segments by town. Grids for rivers were also omitted from the DTM to reduce the amount of data the platform has to process.
After the flood-prone areas are found, the system computes the different depth levels of the flood in various places by intersecting the lower-elevation areas with impact factors, including which populations and protected objects will be affected. This enables users to see how much of the population will probably need to be rescued. In addition, the system assesses the number of residents that nearby emergency shelters can receive and does a network analysis of rescue resources.
All this is presented in 2D thematic maps that also show the distribution of emergency and rescue supplies, the locations of large pieces of construction equipment, where disaster relief agencies are located, and more. Commanders from Taiwan’s Central Emergency Operations Center (CEOC) and 22 local EOCs can then look at these maps on computers and touch screen monitors to determine the extent of relief services needed and arrange their distribution.
The 3D Visualization
Users can also use the Flooding Wargame Simulation Platform to visualize simulated flooding disasters in 3D. This part of the platform is based on the DTM, satellite images, street maps, and the 3D building models. It also integrates real-time video feeds from Taiwan’s closed-circuit television (CCTV) monitors. During flood simulation exercises, this helps on-site rescue units communicate and coordinate with each other so they can develop emergency solutions that take into consideration the potential severity of building damage, flooding, and traffic, as well as the viability of potential rescue and escape routes.
Additionally, the platform makes it easier to engage in flood disaster planning for more vulnerable populations. For example, all senior citizen welfare institutions are shown on-screen, and those located on the first floor are marked specifically to take into consideration elderly people who have lower physical abilities. These details can then help social welfare institutions evaluate their own disaster risk levels and aid other organizations in setting up the government’s Prevention and Evacuation Program, arranging emergency housing, and training rescue and response teams.
Being able to take these precautions—and more—in advance of a real flood-based disaster will ensure that Taiwan is well-prepared to weather big storms.
For more information about the Flooding Wargame Simulation Platform for Training and Emergency Response, email NCDR researcher Wen-Ray Su at wrsu@ncdr.nat.gov.tw.


