Following the end of World War II, a group of veteran pilots shared a dream of using their flying skills to reach isolated communities and better serve people in times of need. To turn this dream into reality, they banded together to create Mission Aviation Fellowship (MAF).

For nearly 80 years, MAF’s goal has been to deliver medical supplies, personnel, food, and hope to communities in isolated areas, from Mozambique and Lesotho in southern Africa to islands in Indonesia and the Caribbean. The organization’s work has spanned 12 countries, and in 2023 alone, MAF conducted 16,207 flights covering more than 1.1 million miles (1.7 million kilometers) to safely transport more than 48,300 passengers to their destinations.
Safety and security are critical for MAF. With its recent adoption of GIS technology, MAF has enhanced its ability to protect its missionaries and pilots, helping them deliver humanitarian aid to some of the most remote areas in the world.
A GIS Vision Takes Shape
In 2022, MAF rolled out an enterprise-wide GIS, revitalizing the way its flight missions are planned and executed.
“I’ve known [about] and used GIS for 30 years,” said MAF global data architect and GIS manager Frank Roberts. “But being at MAF makes me excited with the newness of GIS in the organization. In just a year, we’ve used GIS to visualize airstrips, to support disaster response efforts, and to even create a digital twin.”
MAF’s GIS initiative started by having staff inventory data needs and the data they already had available to support the organization’s various activities. MAF staff also gathered input on organizational challenges and began to outline where GIS could make the biggest impact. With this in mind, staff asked a key question: How can we effectively use GIS to visualize our data, make more informed decisions, and communicate the important work that MAF is doing?
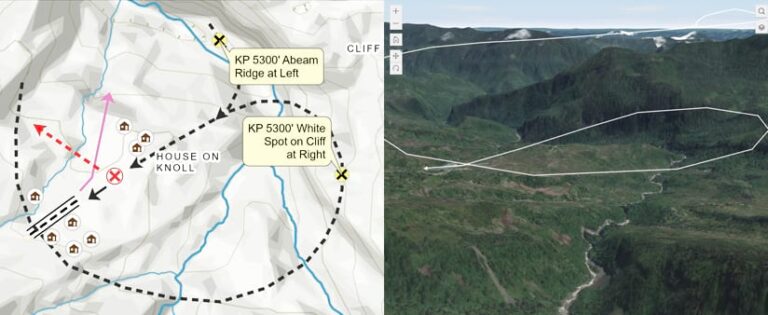
Obtaining answers to questions like this one revealed the projects where the greatest needs could quickly be met. One of the first GIS initiatives identified was to digitize MAF’s transportation operations. Given the vast differences among airstrips in the isolated areas MAF serves, ensuring a safe and accurate flight path is of utmost importance. Many airstrips are located on the sides of mountains, hacked out of thick jungle, and even found on rivers (these are serviced by MAF’s floatplane). The runways are often short; covered in dirt, grass, or water; and not aided by air traffic control.
“The pilots are experts in the areas where they fly, but when a new pilot is joining that region, the briefings include key visualization indicators like, ‘You go down this valley, you take a right at the tree’…and having a means to visualize [terrain] enables our missions to be safer, given that our pilots fly into some of the most challenging airstrips in the world,” Roberts said.

To help the pilots, the MAF team used ArcGIS Online, ArcGIS Pro, and ArcPy to create MAF Globe, a 3D GIS tool that allows pilots to interactively spin a digital globe and zoom in to specific runways. The MAF team made this tool available for all its pilots via ArcGIS Enterprise, enabling them to prepare for their flight operations no matter where the missions occurred.
Before they used MAF Globe, pilots often relied on hand-drawn maps. To enable better and more accurate flight planning for future missions, MAF is using ArcGIS Pro and a configured ArcGIS Experience Builder app to digitize older maps to scale and incorporate important new features such as hillshades. This will furnish pilots with a more detailed and accurate representation of the terrain they will encounter, allowing them to be better prepared for their missions.
Using ArcGIS StoryMaps to Understand Disasters
With bases and airplanes around the world, MAF’s pilots are often among the first to fly over affected areas after a disaster. They help assess the impact by capturing images of these areas from the sky.
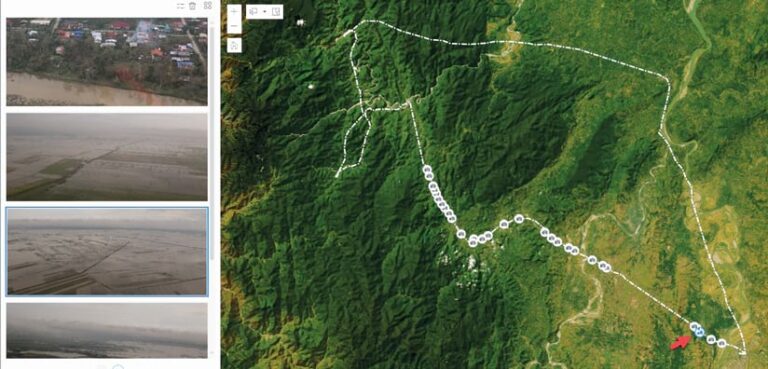
Using ArcGIS StoryMaps, MAF now shares this imagery with other responders to help them understand the situation before they arrive on scene. With GIS, the MAF team has implemented an important new feature—the ability to quickly see before-and-after imagery of the area to better understand the infrastructure and terrain that existed prior to these catastrophic events.

In 2019, Mozambique had two major cyclones. Despite weather experts’ having anticipated minimal damage, the reality was vastly different, as communities were severely affected by extensive flooding. The MAF team quickly prepared the organization’s fleet of airplanes and positioned them to take flight once the storm had passed.
“During the flights, pilots discovered extensive flooding, and people were stranded, which meant critical needs were not being met,” said MAF director of communications Brad Hoaglun. “Knowing that our MAF GIS team can now take photos and populate those into a map helps our response efforts immensely. It’s exciting to know that we can share this with our partners and donors to see how much of an impact we’re making in these isolated areas.”
MAF GIS analyst Cole McCall further explained, “Our goal is to create an online mapping tool that will allow responders to be able to get the photos with one to two clicks, helping them identify where the most damage is located. MAF partners with more than 400 organizations, and to get them information with ease would enhance our response efforts as a team.”
Visual Storytelling and Building a Digital Twin
GIS has made its way through various initiatives across MAF. One new project is having pilots share their stories with others to help keep them doing what they love most.
Planes and operations are not cheap, and as a nonprofit organization, MAF needs every pilot and mechanic to help fundraise to support field operations. Using ArcGIS StoryMaps, pilots are sharing their passion with donors.
“[ArcGIS] StoryMaps [stories] are the best way to visually share information about the pilot [and] understand where their heart is and what their mission is,” McCall said.
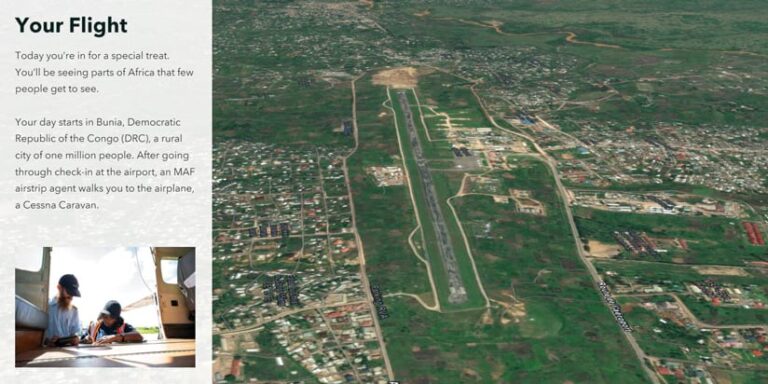
This effort evolved from sharing introductory information into providing a complete storytelling tool for mission efforts. ArcGIS StoryMaps stories now deliver a 3D visual experience of flights, displaying interesting features—such as wildlife reserves and even the dangers of local militia forces on the ground—to help convey the complexity of these missions.

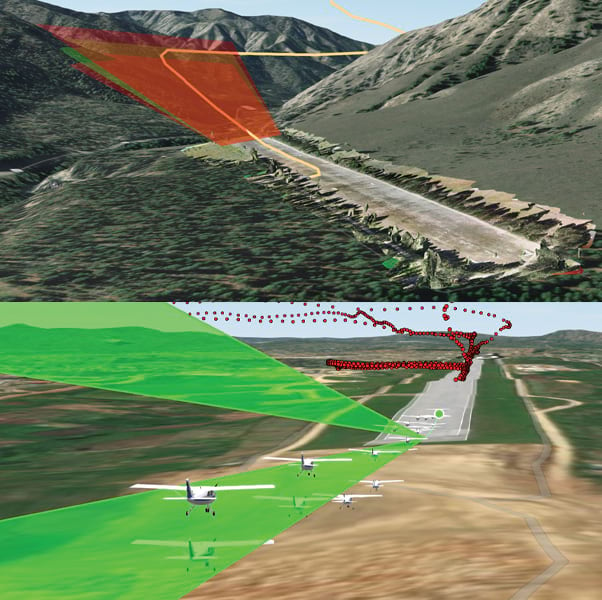
MAF’s latest GIS initiative is using a digital twin to enhance pilots’ flight paths. To create the digital twin, the MAF team used GPS data from flight logs and imagery from drones and then processed everything with ArcGIS Drone2Map. All this helps pilots visualize the latitude, longitude, and elevation of their flights so that they can prepare for their missions—with a 3D view from takeoff to landing—and navigate properly.
“Once the data has been overlaid, we can see the approach just using two clicks to get the data and two clicks to add the features to the map,” McCall said.
Uncovering the Potential of GIS
The MAF team accomplished all these projects in just one year.
“When I first came onboard at MAF,” Roberts said, “I just did some sample visualizations. Those sample visualizations helped people understand GIS because they had not seen GIS used in this way [and didn’t know] what GIS was.”
With aviation being geographically focused, MAF’s CEO recognizes the value of GIS not only for aviation operations but also for the rest of the organization, according to Roberts.
“We’re just scratching the surface of how we can use GIS,” he said. “Knowing we are making impacts at this scale makes me and us feel accomplished in our line of work. It’s very impressive how this technology is being embraced by the organization.”

