

October 3, 2023 |
September 10, 2024
The Oklahoma City Office of Sustainability’s first deep dive into digital mapping showed just how important spatial awareness can be—especially when it comes to extreme summer heat.
For context, this state capital is similar in size to New York City at 621 square miles. But its population of about 750,000 is more spread out than the roughly 8 million people clustering in the Big Apple.
The sustainability team, which sits within the Planning Department, gained crucial insights when they mapped summer temperatures and air quality data across over half of the city. They learned that having fewer people, buildings, and paved surfaces hasn’t shielded the Big Friendly from big-city concerns.
The sustainability team posted the temperatures onto interactive maps using geographic information system (GIS) technology. These maps now serve as a vital tool for local agencies and the public, highlighting health risks and guiding services to vulnerable households.

A few things became clear through the project:
First, the maps revealed neighborhoods where temperatures are hottest, and air quality is poorer. Deaths and heat-related illnesses rise during heat waves, and most are preventable. The work to identify hot spots uncovered places to focus intervention.
Second, mapping air quality sensor locations revealed critical gaps in the city’s monitoring coverage. The city could face costly penalties if it exceeds federal air quality standards.
Equally important, the analysis made it clear that, as in other cities, communities need to develop additional strategies for addressing rising temperatures. Planting trees and other landscaping is important, but more is required to bring relief to the hottest areas.
“What we’ve had in place over the past 10 or 15 years, it has not worked,” said Sarah Terry-Cobo, associate planner in the Planning Department’s Office of Sustainability, commenting on the tree planting and landscaping effort in the city’s northwest.
Oklahoma City is one of 18 communities around the world chosen to join the 2023 CAPA Heat Watch program, which is funded by the National Oceanic and Atmospheric Administration (NOAA).
The program implemented by CAPA Strategies, a consultant, brings together local partners and residents to map and study how heat is distributed in their communities. Past participants have used the results to promote sustainability and climate resilience in public health, urban forestry, and other areas.
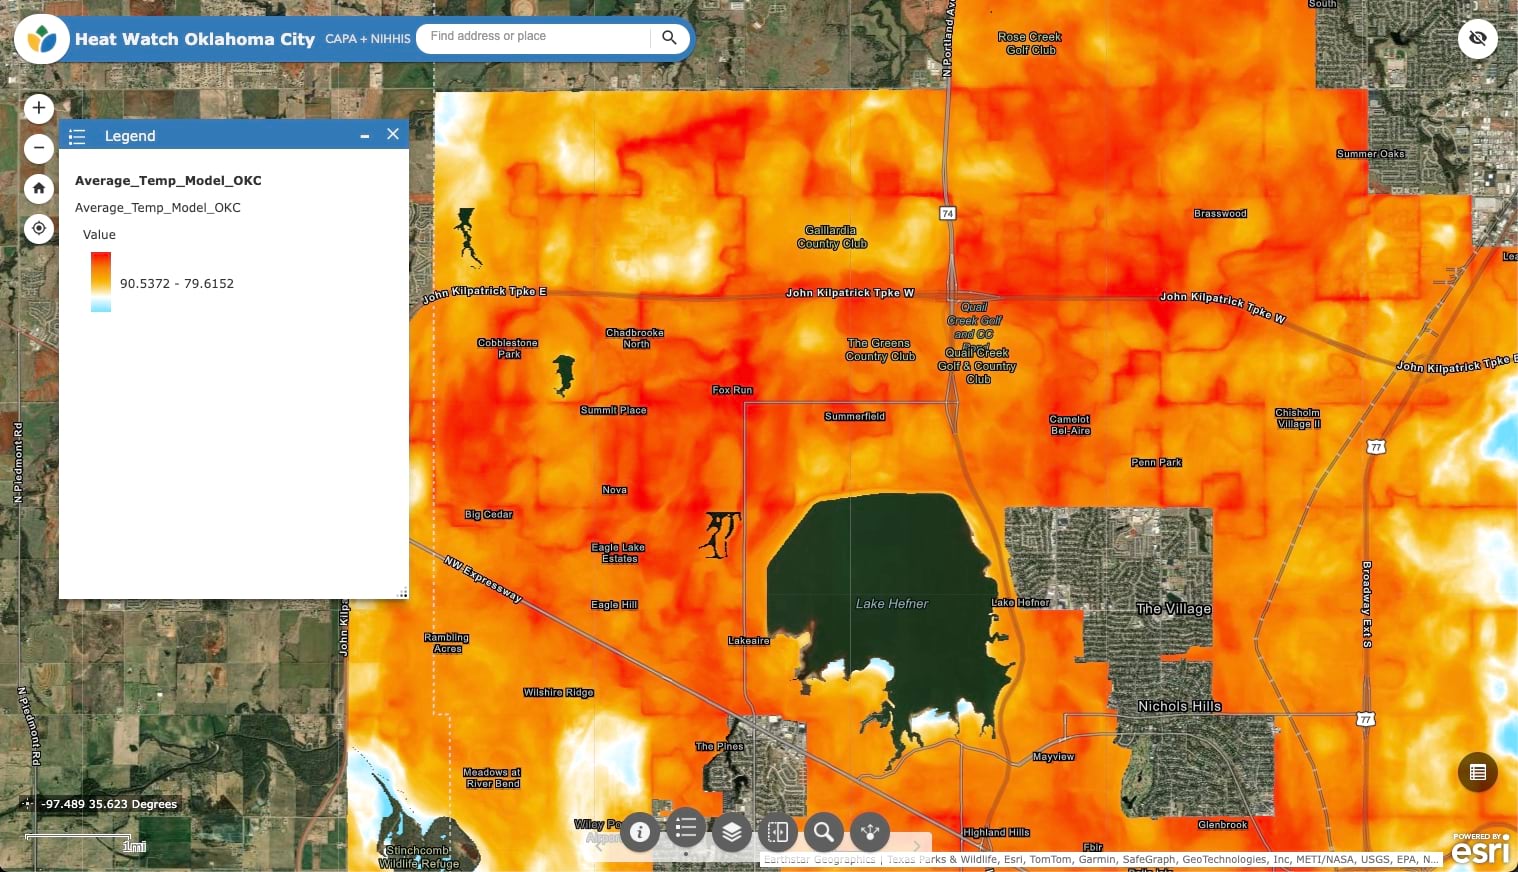
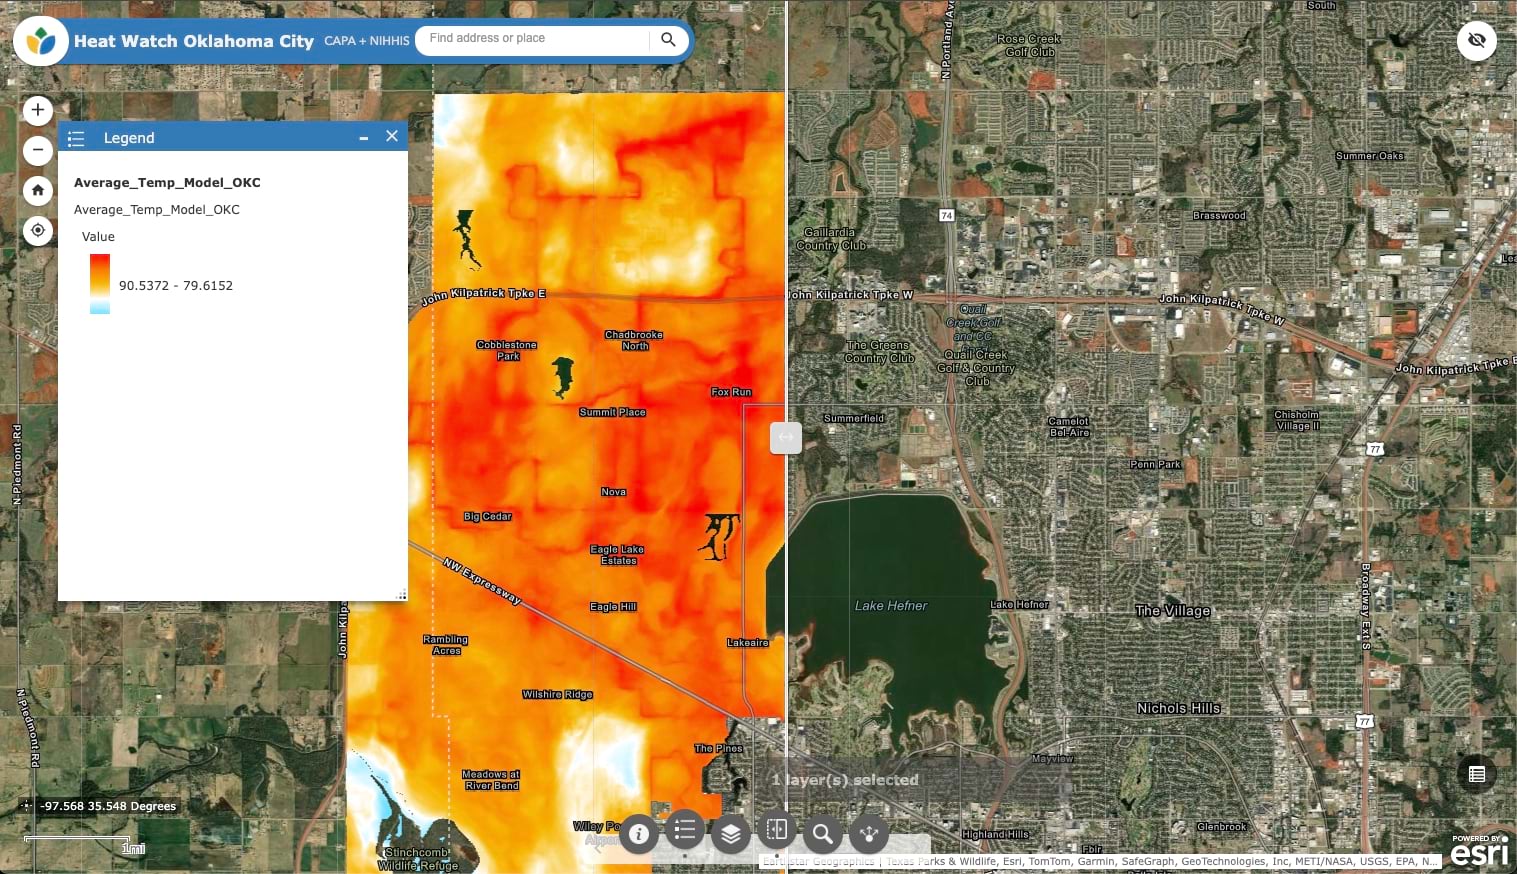
The interactive, color-coded GIS-based maps that Oklahoma City’s sustainability team commissioned combine temperature data from NOAA with local temperature data collected by volunteers.
Merging the two types of data, NOAA develops a heat index to better assess how hot it feels to the human body at a given time and place. The heat index also considers humidity levels and other factors.
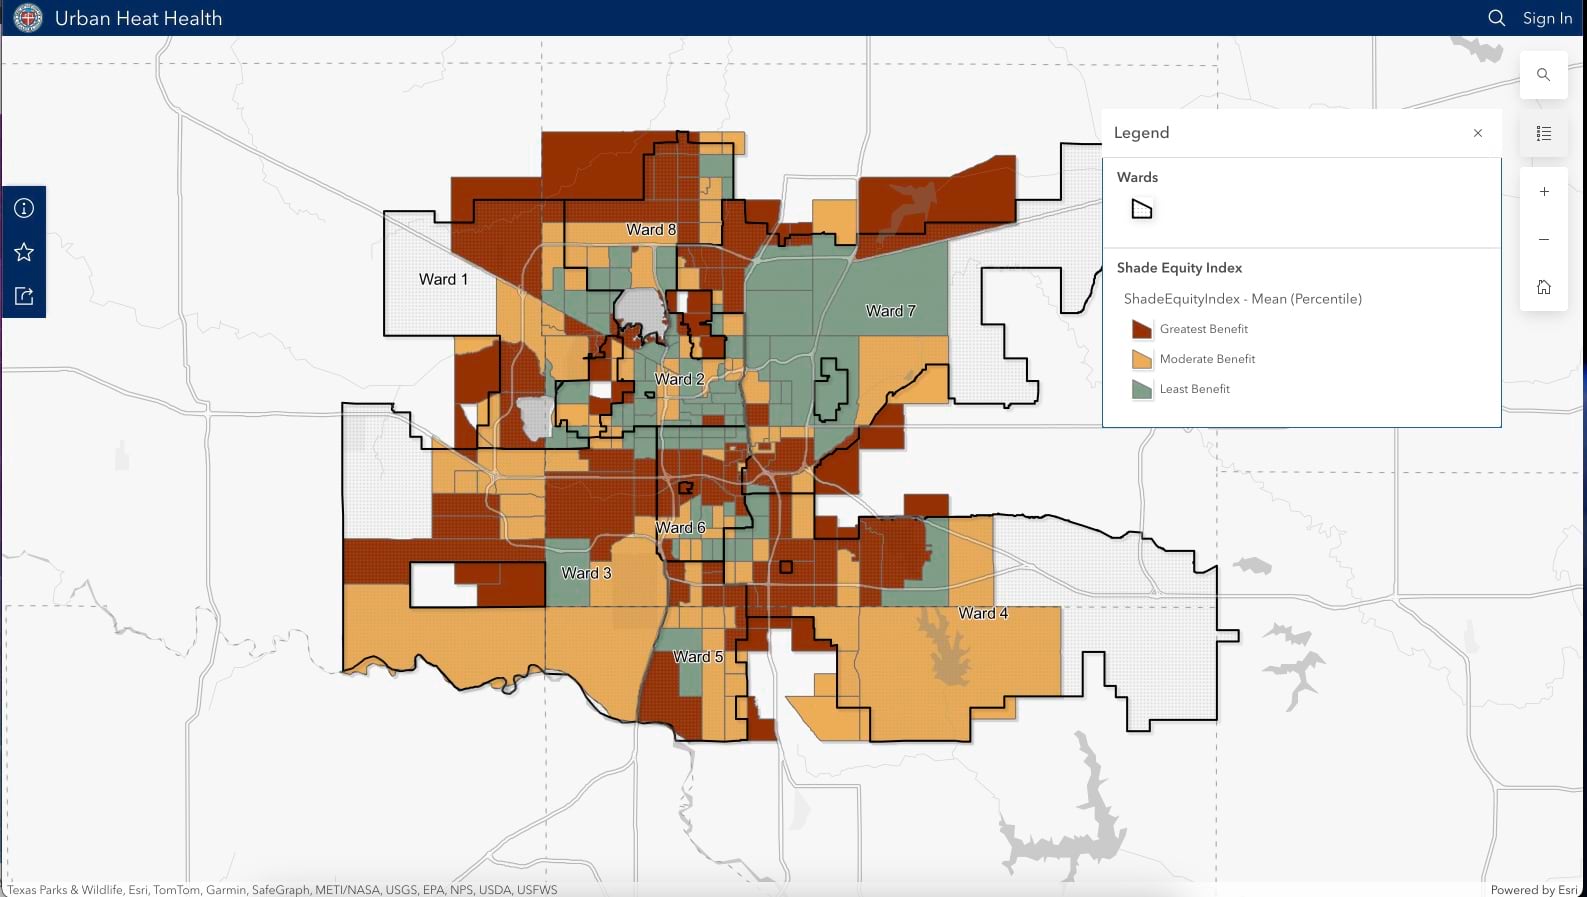
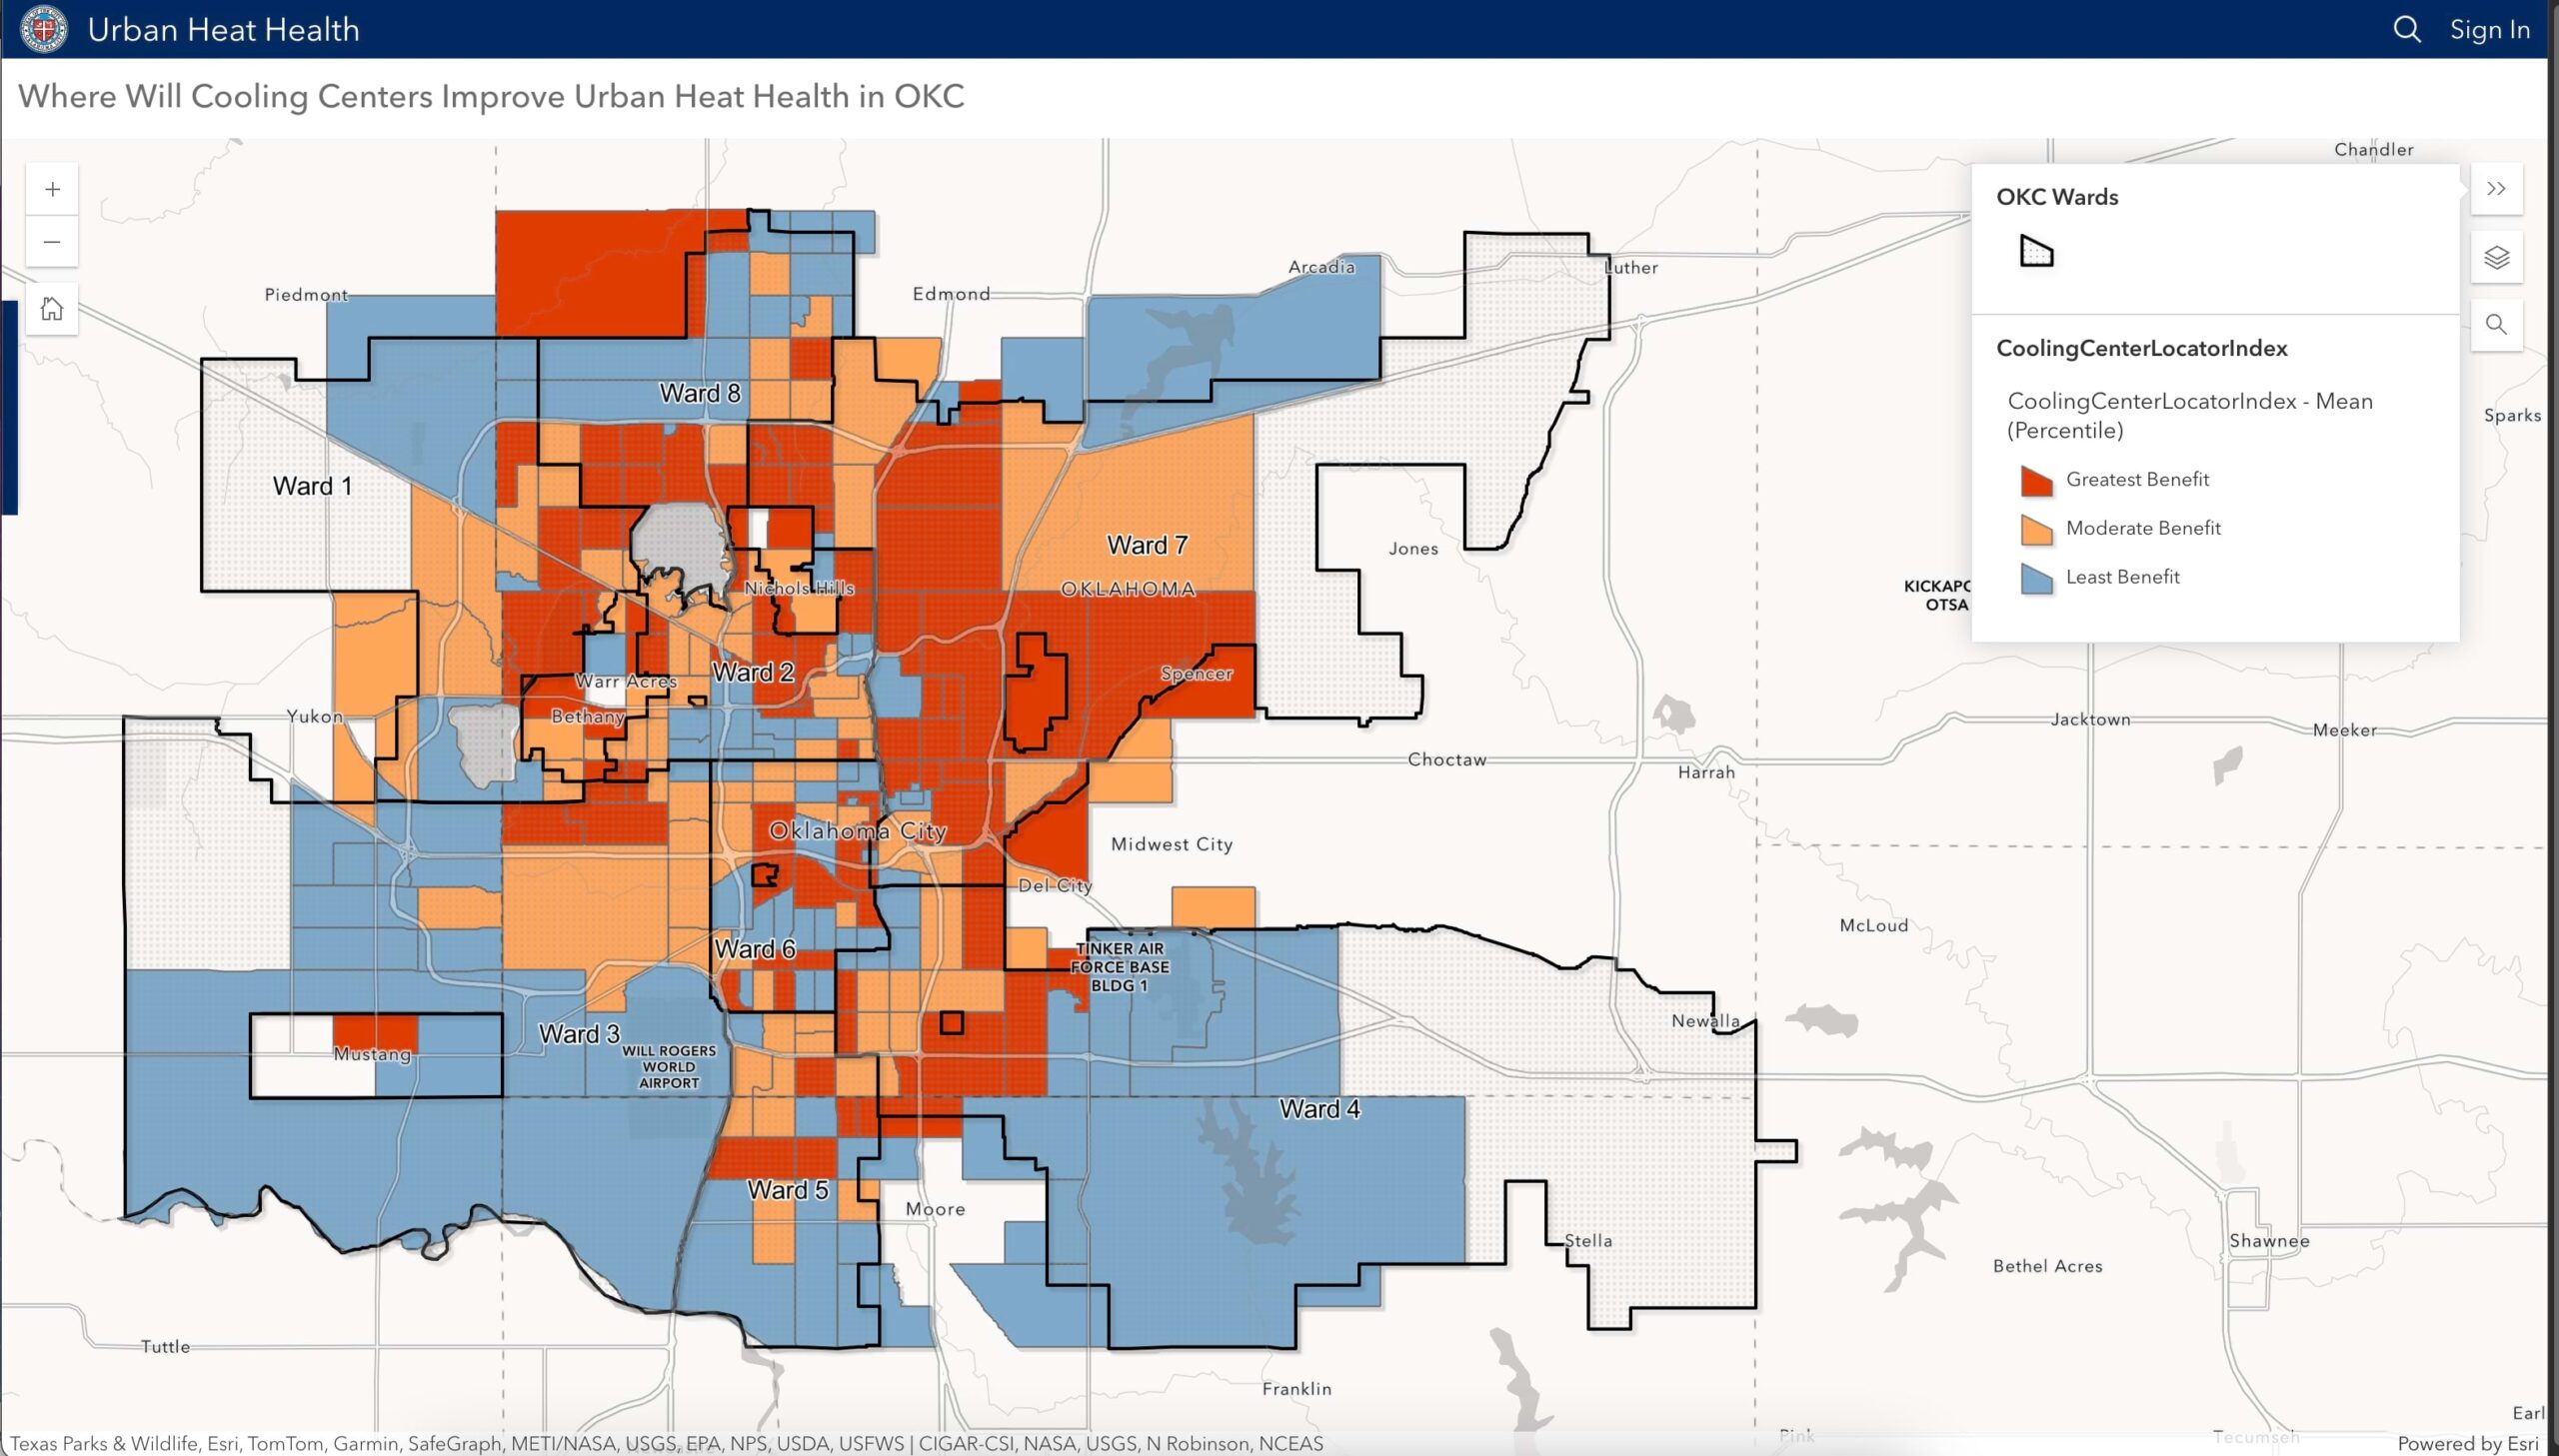
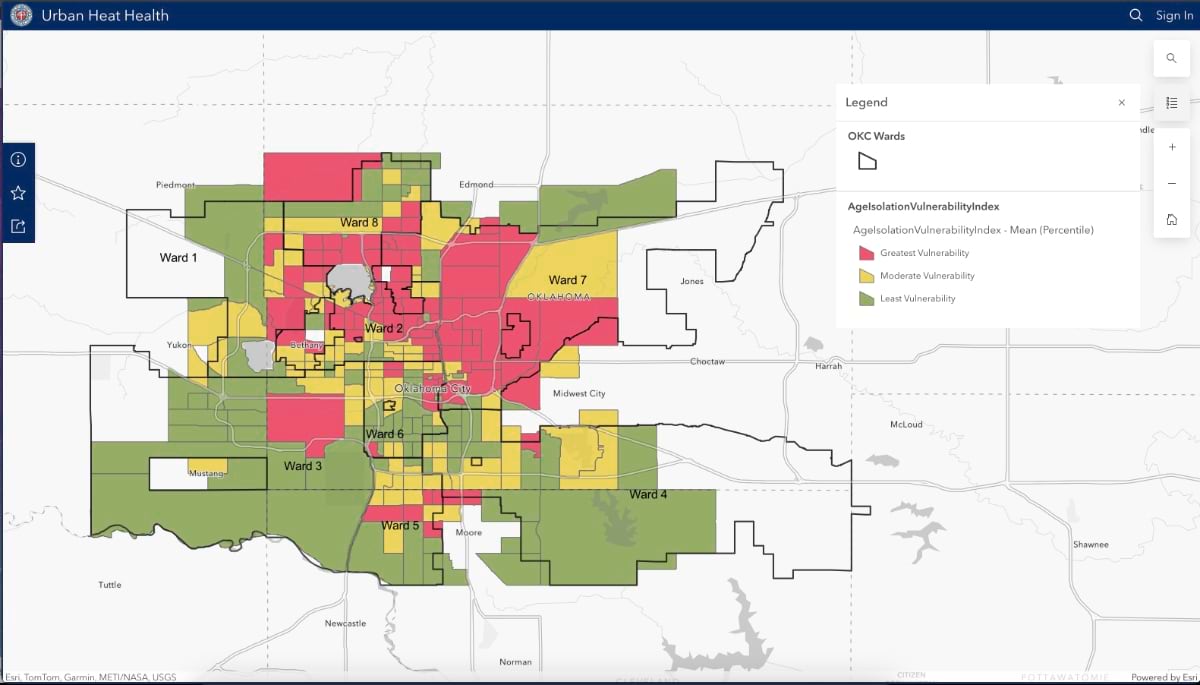
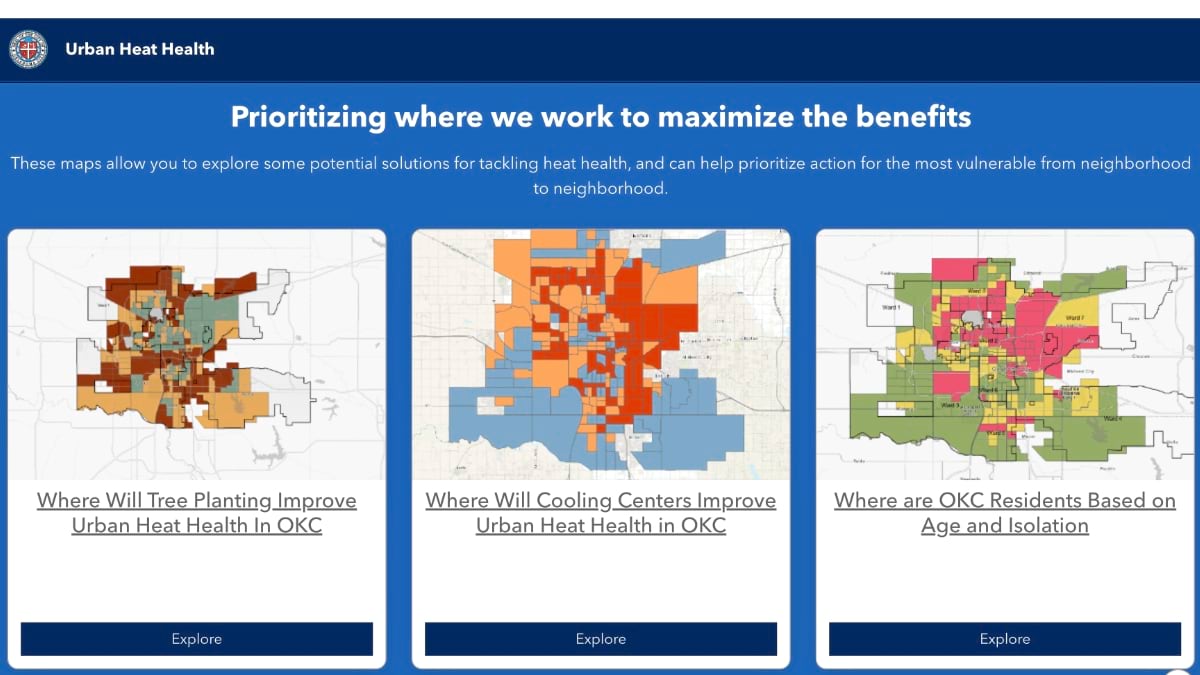
For Oklahoma City’s project, analysts looked at summertime temperatures, air quality readings, and demographic information such as age and poverty levels within US census tracts. The city’s heat maps, a related dashboard, surveys, and other research are published on a site created with ArcGIS Hub called Heat Health in Oklahoma City.
Visitors to the city’s hub site can see how temperatures vary across geographic areas that are diverse in population size, building density, wealth, ethnicity, and other characteristics.
“We want be able to identify which of the census tracts have people who are over 65 and who live alone because, historically and statistically, those are the folks who are at the highest risk during heat waves,” Terry-Cobo said.
Using GIS tools, other data layers can be added to maps to identify patterns and correlations. The city’s hub site presents GIS maps that visitors can interact with if they want to learn more about a specific neighborhood.
“We can learn only so much from static reports,” Terry-Cobo said. “With [GIS] tools like these, we can keep digging. We can keep adding on [data] layers and trying to understand the different facets of extreme heat and urban heat islands. Also, it’s huge for us to be able to see the change over time.”
Local agencies and partners can use the maps to pinpoint hot spots as they make plans for adapting to rising temperatures and concentrations of air pollution. For example, building resilience to extreme heat might include determining strategic locations for planting trees, opening cooling centers, and delivering services to residents who have a greater risk of succumbing to heat-related illness or death.
In Oklahoma City, spatial analysis with GIS technology showed that urban heat islands exist in the expected places—in marginalized communities and the downtown area. Both have more concrete and asphalt surfaces and fewer green or shady spaces.
As early as 6 a.m., the downtown area saw temperatures at or near 88.5 degrees in August 2023. The heat index was “well over 100 degrees,” Terry-Cobo said. Those temperatures downtown were almost 15 degrees hotter than some other parts of the city.
The study also showed that Oklahoma City’s growing, affluent northwestern quadrant has taken on more of the concrete and asphalt characteristics of a heat island. Its location apart from downtown makes it a more surprising hot spot. Detecting even subtle shifts in local conditions is valuable for planners, Terry-Cobo said.
“Being able to really capture how humans feel heat on the ground, that shows us the disparities and the differences between neighborhoods,” she said. “That was something that really hadn’t been done before [in Oklahoma City].”
With just two staff members, the city’s sustainability team relies on partnerships to move the city toward its goals, including resilience to climate change.
The city’s hub site is a resource that can guide partners as they work to reach at-risk households. For example, electric companies can use the hub site’s data to identify households that might be eligible for credits or discounts during summer months.
With lower monthly utility bills, more of the most vulnerable residents might choose to turn on their air conditioners to lower their risk of heat illness. Public transit planners might use heat maps in choosing locations for shaded bus stops or planting shade trees. Heat maps might even surface as the city considers a plan to build America’s tallest building on a four-acre parking lot downtown.
As urban planners look to the future, equitable allocation of resources will be important to address disproportionate burdens on communities where investment has lagged. Heat maps can help urban planners identify gaps in services or infrastructure.
“Spatial analysis is crucial to that long-range planning work that we do in the planning department, but also in sustainability,” Terry-Cobo said. “It helps us identify those trends and the patterns. It helps us prioritize where we work in terms of location, geography, but also what we work on.”
Learn more about how location-based solutions drive successful climate adaptation and mitigation strategies.


October 3, 2023 |

April 27, 2021 |

October 27, 2022 |