Q&A: Good Governance in Minnesota Starts with Geospatial Data
By Patricia Cummens
Minnesota has been making headlines recently for its data-driven policies impacting energy, employment, and education. Behind the scenes, a portfolio of geographic information system (GIS) maps and dashboards support decision-making, communication, and collaboration while enabling the state to achieve important economic milestones and drive efficiency.
In this interview, Alison Slaats, Minnesota’s chief geospatial information officer, discusses the state’s innovative approaches to visualizing and analyzing data with GIS, and making data more accessible.
A: The state has done a good job of aggregating authoritative data together in a uniform way for bigger analysis across the landscape. The Minnesota geospatial community, over time, has worked together to build up a great data-sharing environment. These data serve the broader community, all levels of government, nonprofits, the private sector, and our tribal nation partners.
GIS at the state started back in 1977. Since then, the state agencies have collaborated. Counties and local government have been responsible for a lot of the data creation and maintenance, like parcel data, addresses, road centerlines, and so on.
The Minnesota Geospatial Commons, our state data clearinghouse, provides access to anyone. We have 48 publishers—including state agencies, counties, and other groups—that have shared more than 1,000 resources. We’re working to modernize the site to make datasets accessible through web services so they can be directly included in web or desktop applications for analysis, ensuring people have the most up-to-date data.
One of the things that has been very important to Minnesota is metadata [data about the data, such as who created it and when, and at what scale and frequency of update]. We even have our own metadata guidelines. I think it has really served us well because no matter what data set you find on the Commons; it must have a good metadata record.
Q: How will advances in AI impact the work you’re doing?
A: We know that AI is coming, and we know that natural language AI is going to incorporate geospatial data in the future. We know metadata is needed to do that well, so you can be assured that the answers come from authoritative data sources. The great tradition of having good metadata in Minnesota is setting us up well for the future of GIS and geospatial analysis to help us make better decisions. I’m excited to see how that plays out.
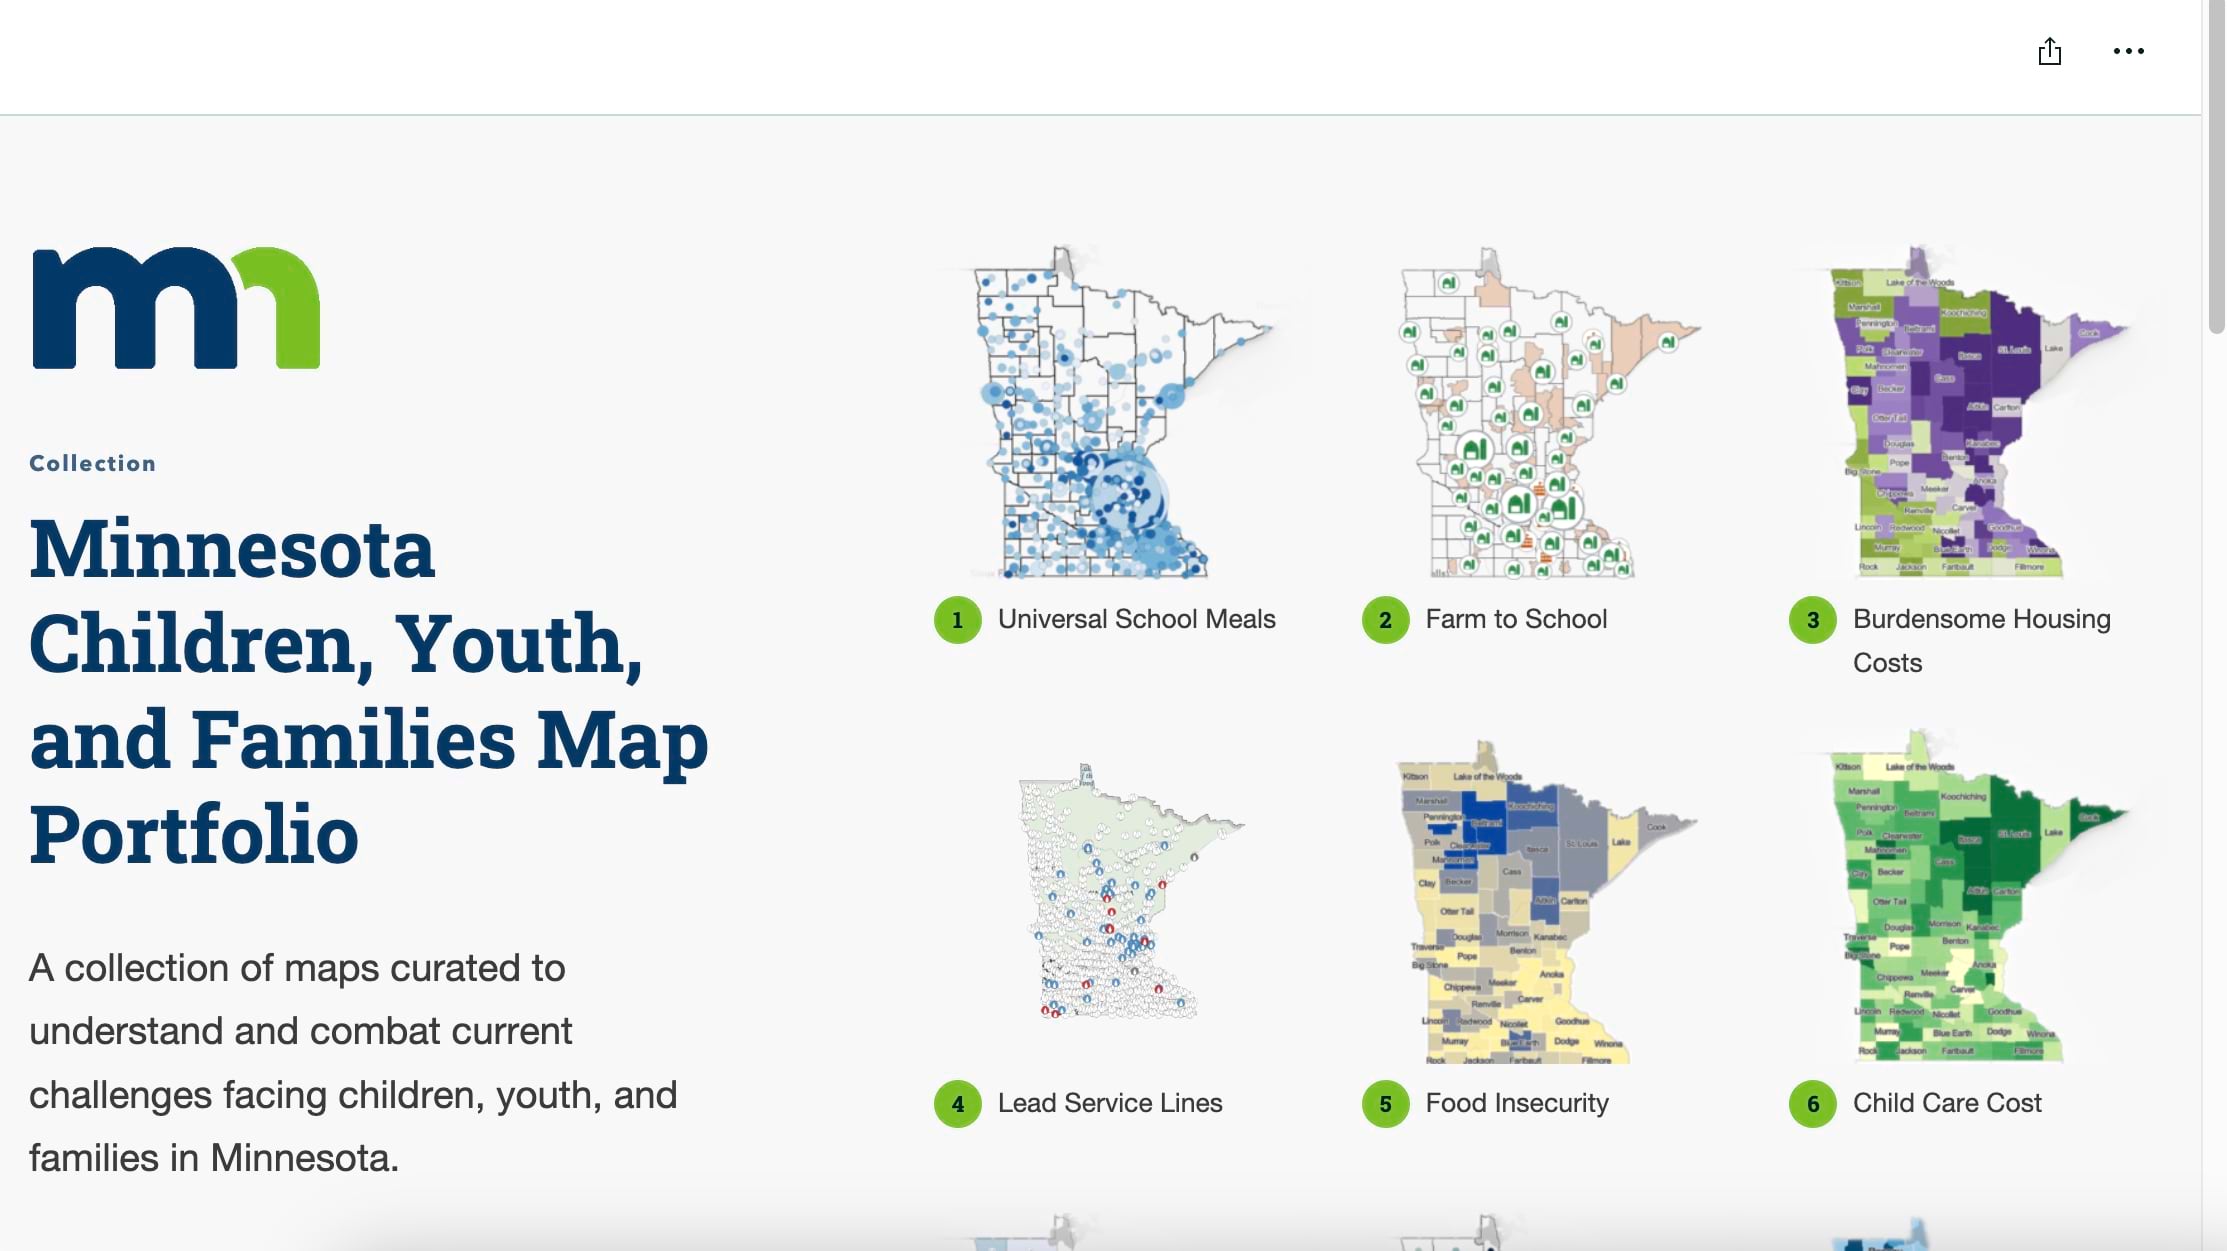
The Minnesota Geospatial Information Office (MnGeo) created this collection of maps to help leadership understand and solve current challenges facing children, youth, and families in Minnesota.
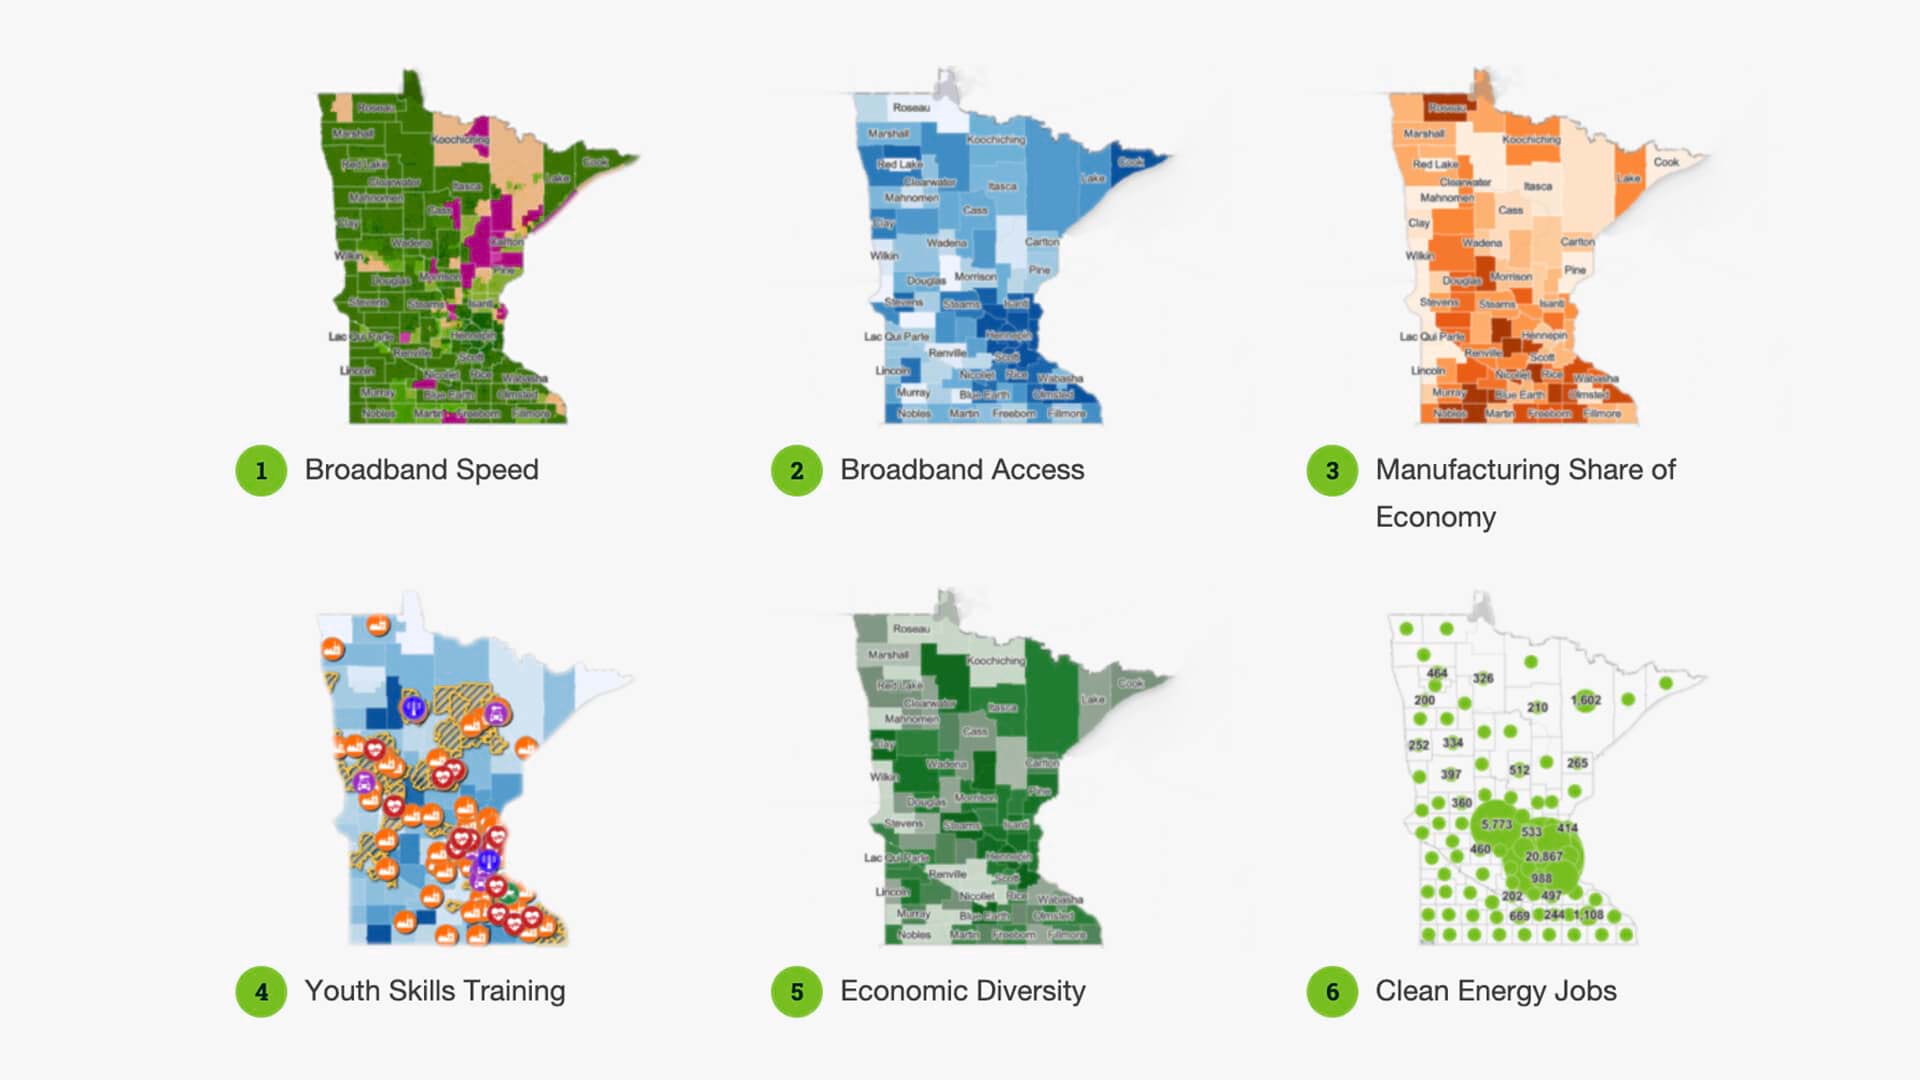
Economic indicators are mapped, including jobs per sector, training resources, and enablers for commerce, such as broadband speed.
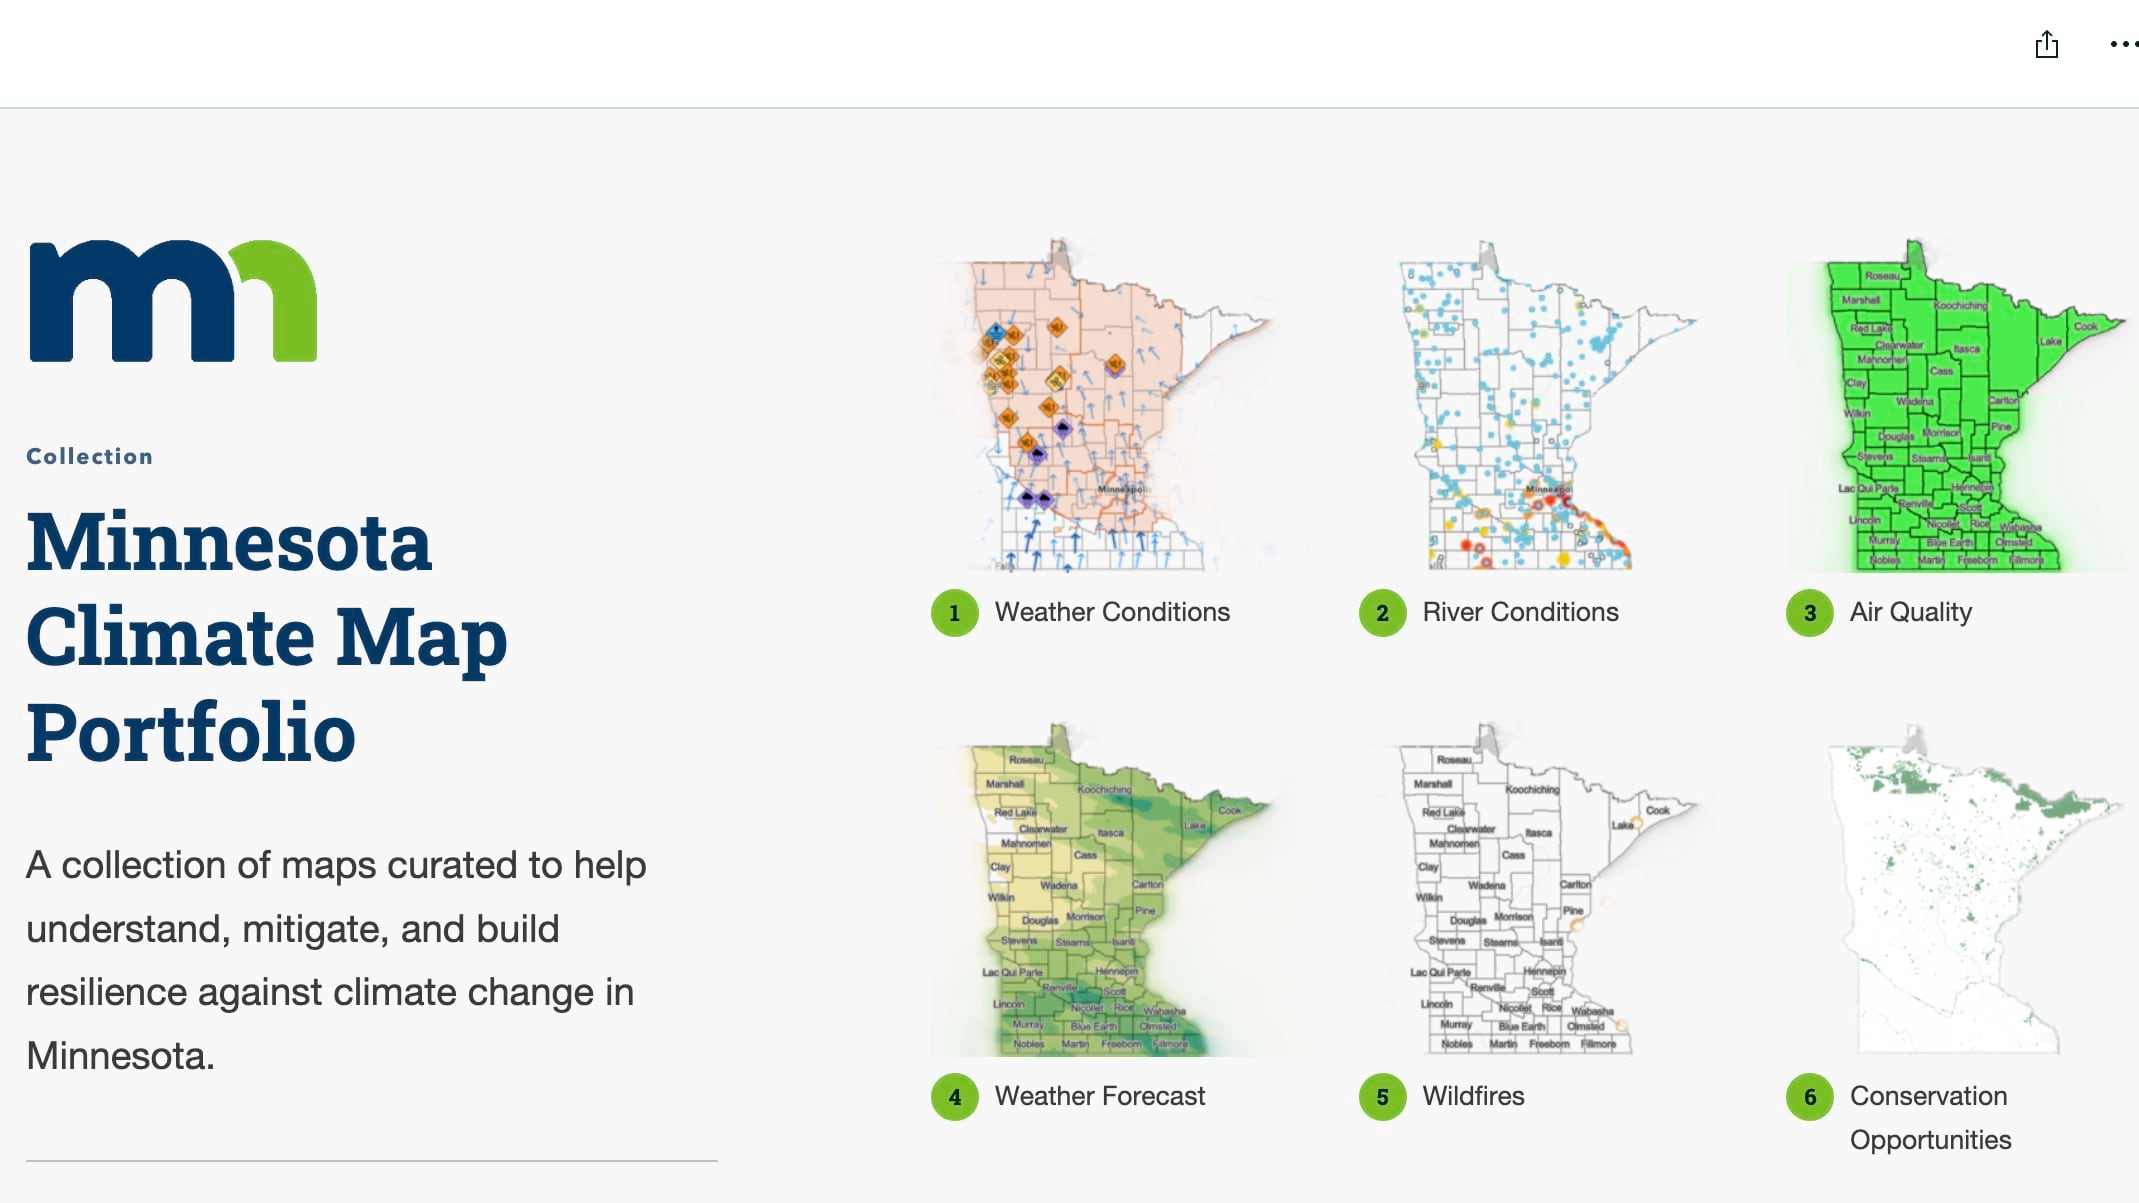
Minnesotans can review maps of water, wildfires, floods, and other pressures to understand the impact of climate change.
Maps that relate the challenges facing Minnesota youth are gathered into a collection that policy makers and the public can use to become informed of issues in their area.
Q: How does GIS foster communication and collaboration around important policy decisions in Minnesota?
A: We’re all seeing the same map … and we’re able to understand the topic in the same way. I’m seeing that more and more with state agencies as we’re considering things like social equity, access to resources, and how that relates to policy decisions.
One recent initiative is Minnesota’s Broadband Equity, Access and Deployment program. The goal is to provide border-to-border high-speed internet access. We partner with the Department of Employment and Economic Development to create and use maps to identify areas in the state that are underserved. We can agree on where the gaps are, and then decisions can be made about mitigating that and providing funding to solve that problem.
Many questions that we face in Minnesota are similar everywhere. They have a geographic component. If you have solid geospatial data and GIS tools, you can really empower people to see the answer, with the goal of improving people’s lives.
Alison Slaats
Chief Geospatial Information Officer for the State of Minnesota
Q: What are some other examples of Minnesota using data and technology to address important issues?
A: There has been a return on investment that is tangible. For example, we recently helped the Department of Transportation create an equity map for the suitability of active transportation—for pedestrians and cycling. And we worked with the Department of Revenue on hosting and updating their sales tax map so anyone can see where and why sales tax is different in different cities.
With COVID, we were one of a couple of states that used mapping to look at vulnerable populations so we could better deliver vaccines. That proved to be successful to get people vaccinated, which reduced the rate of transmission and lessened the incidence of severe illness in Minnesota.
With avian influenza, starting in 2015 when it first became an issue, I supported the Department of Agriculture and the Board of Animal Health. We were very active in that response, working with local and federal agencies. The first question was, “Where are the impacted farms?” If poultry needed to be moved, we had to understand the boundaries of the impacted farm. One of the neat things we did is to create a custom view of the data for the poultry industry to look at the same maps the state and federal agencies were looking at. We were all looking at the same map and understanding the issue together.
Q: What’s one tactic that has made your leadership effective?
A: Throughout my career, I’ve been focused on creating great data and sharing great data. To share great data, you need to build relationships. You need to have relationships with the data producers, with the data users, and then, of course, have the tools to share data in ways that are useful for analysis, in web-based apps, and desktop analysis tools.
Q: How does Minnesota benefit from a statewide use of GIS through its Geographic Information Office (GIO)?
A: Our office supports all agency partners. That’s one of the benefits of having a centralized GIO office within the state IT department. When there are available federal funds, such as for broadband, our agency partners work with us to accomplish their results. They receive funds and we help them fulfill their needs. It works well, because they are the subject matter experts, and we apply our technical skills to support their work.
I think agency work and the support of GIS experts and the GIO office come together, and honestly improve our daily lives in Minnesota. By making data available and process more transparent, we are showing people that we’re delivering good services and value to the people of Minnesota.
Q: Do you have a favorite map?
A: Someone recently asked us the question, “Where in Minnesota is ‘up North.’” It comes up often in chat rooms and local media. It’s funny for us because it’s an imaginary map. It’s your own mental map of what you value. For me, it’s where I can start to smell the pine trees, hear the loons, and be by a lake.
I know it’s a strange answer, but I think we can all relate. Maps help us understand the way we exist in our landscape, how we’re part of a community, and part of our environment.
Patricia Cummens is the Director of Government Strategy and Policy Solutions at Esri where she provides guidance on state and national government initiatives and emerging policy issues. The digital divide has been an area of focus for her for some time. She works with executives including Governor's offices, the White House, and US congress, and has experience as GIS Director for the New Jersey Department of Environmental Protection after launching her career with State of Minnesota. Her skills bridge the gap between policy and technology, helping governments understand the value of geospatial data and GIS technology for efficient, smart government.