
August 31, 2023 |
May 28, 2024
“In some states, we only have one or two ground-based stations,” said Xiong Liu, a senior physicist and TEMPO’s deputy principal investigator at the Smithsonian Astrophysical Observatory and a member of the Center for Astrophysics | Harvard & Smithsonian. In other parts of the world, pollution data is even harder to come by.
But Liu and his colleagues are quietly working to revolutionize our view of the skies. Over the past several months, an instrument they developed, called TEMPO, has begun providing measurements of harmful aerosols and gases in our air (currently including nitrogen dioxide and ozone, and eventually including sulfur dioxide, bromine monoxide, and organic molecules like formaldehyde) at unprecedented scale, and from the highest perch a pollution-hunter has ever had: some 22,000 miles above North America.
Even after a decade of development and preparation, looking at the first images, Liu was stunned. “We’re amazed by the detail,” he said.
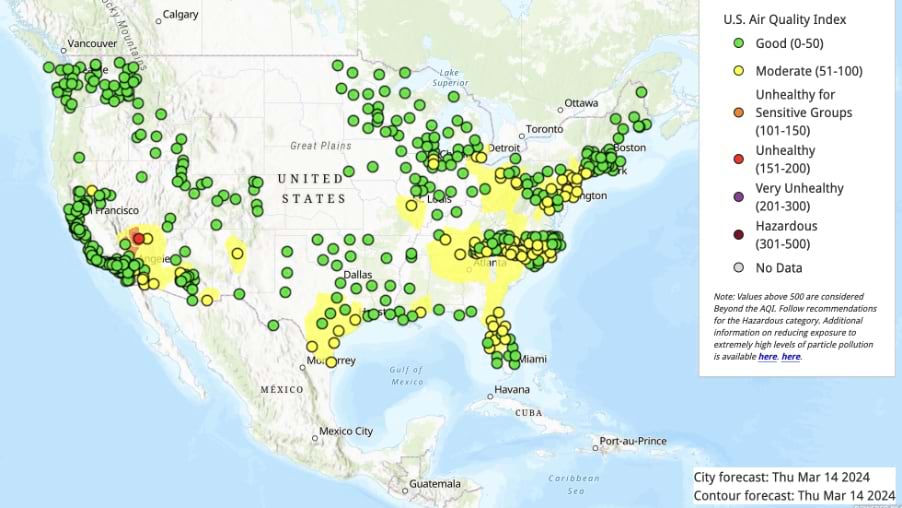
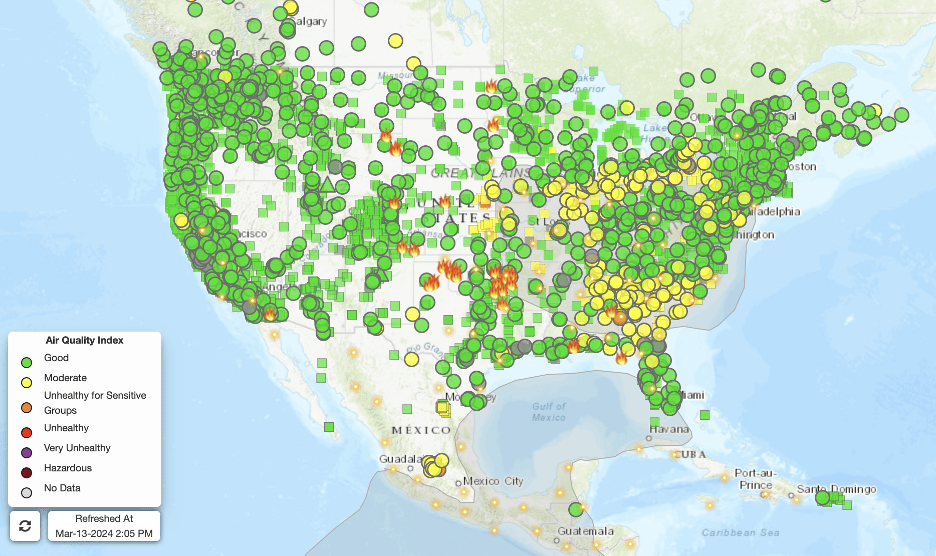
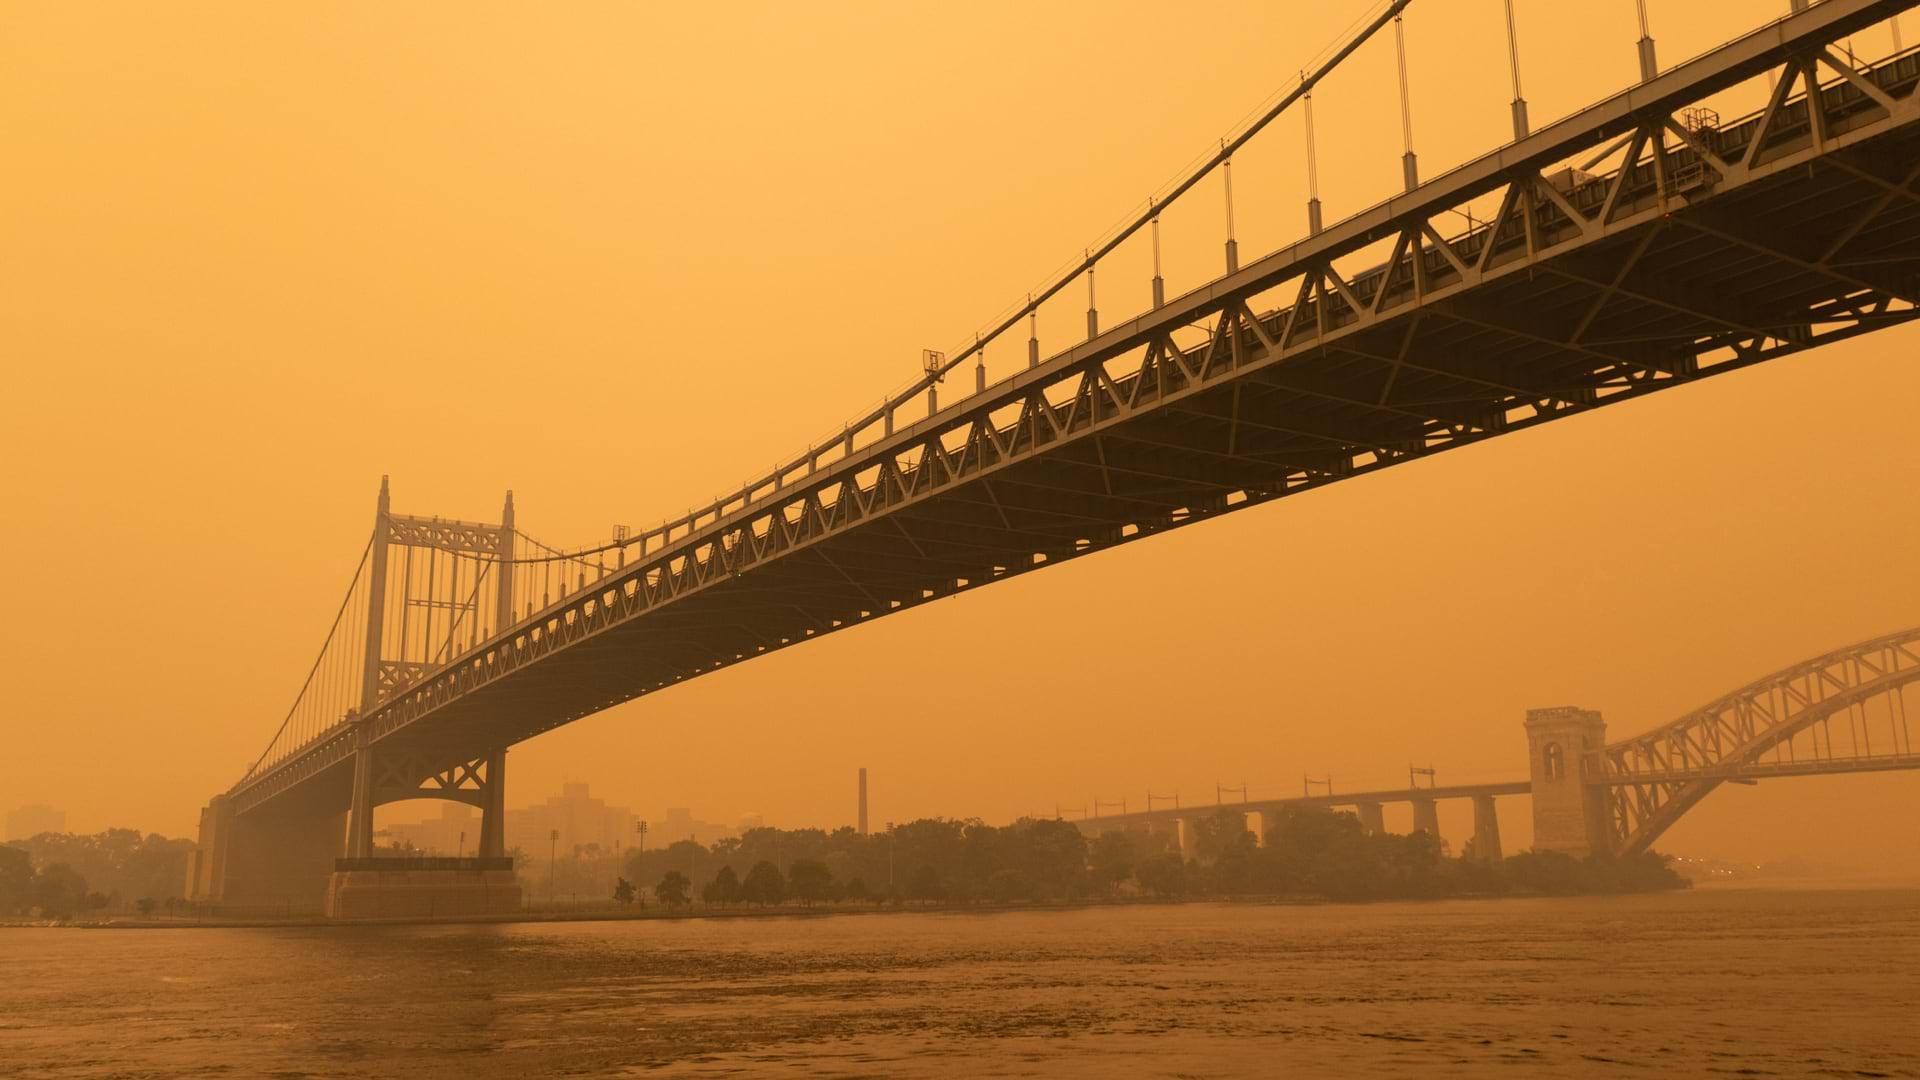
There’s already an international fleet of air monitoring satellites in low earth orbit, about 300 miles up, which take observations along their path as they circle the Earth once a day. These instruments combine with ground stations to inform measurements like the Environmental Protection Agency’s (EPA) air quality index (AQI). But—as wildfire smoke reminded millions of people in North America last summer—these readings can still be imprecise and arrive too late.
As NASA’s first earth-observation instrument located in geostationary orbit, TEMPO, or Tropospheric Emissions: Monitoring of Pollution, sits far higher up than existing satellites and remains over a single point on Earth, allowing it to see more pollution for longer. It can take ten to 14 scans daily, from Canada’s oil sands to Mexico’s Yucatán Peninsula, from the Atlantic Ocean to the Pacific Ocean. (TEMPO is collaborating with an international team of scientists from Canada, Cuba, Mexico, and the US.)
That rhythm, of imaging the Earth at a blistering pace of about once-an-hour, helped give the instrument its name. “Basically, it’s going to sit over the equator and scan over North America, East to west, over and over,” said Liu. “Like the tempo of a musical instrument.”
Alongside its frequency and unusual height, TEMPO’s big innovation is its spectrometer. By detecting tiny differences when sunlight hits molecules in the atmosphere and gets absorbed at specific wavelengths, spectrometers allow scientists to measure concentrations of trace gases in the troposphere, the innermost part of the atmosphere. But while other space-based spectrometers in the US can only see gas concentrations at a resolution of, at most, the size of a city; TEMPO can see down to about four-square miles, or about the size of the Washington Mall.
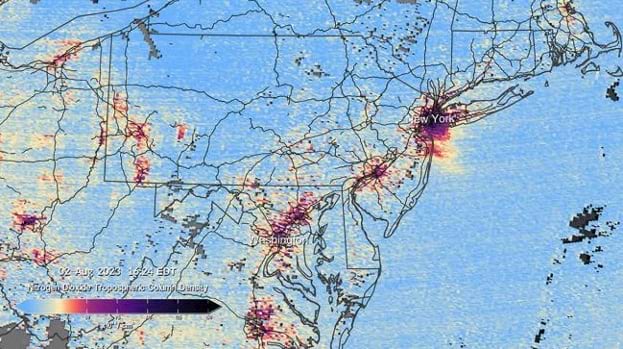
Beginning at 11:15 AM Eastern Daylight Time on August 2, 2023, TEMPO scanned the continent every hour for six consecutive hours. This animation shows nitrogen dioxide over the country and zooms in on the east coast, Texas, and Southern California (Video courtesy of NASA and the TEMPO mission).
“Now we’re able to see small, individual point sources in each city and hourly measurements for highways, with variations from hour to hour,” Liu said. “We’re able to see a lot of details at the neighborhood scale.”
In recent years, the EPA, the US Forest Service, and others have tried to enhance pollution maps by incorporating data from a growing community of citizen air watchers. But there aren’t enough devices—the community-managed air monitors tend to be in wealthier or whiter communities—and they aren’t sampled frequently enough to generate accurate, reliable pollution forecasts. And along with existing space-based sensors, community-managed monitors can provide only a limited portrait of how pollution moves in different weather conditions, for instance, or the ways it impacts the most vulnerable populations the hardest.
Bad air—ground-level ozone pollution and fine particulate matter (PM2.5)—lead to more than 100,000 premature deaths and billions of dollars in annual damages in the US, according to the National Weather Service. Liu cited stats from the American Lung Association’s 2023 State of the Air report: “One-third of the American population is still affected by unhealthy air pollution,” he said. “And people of color are more likely to be affected by air pollution because they tend to live closer to some of the biggest sources.”
Recent research has used satellite observations of nitrogen dioxide to identify disparities in cities, showing that higher fossil fuel emissions occur in low-income and nonwhite communities.
Critically, TEMPO can provide data in such high spatial resolution that it’s possible to spot the actual sources behind these disparities. By combining its readings with data from ground-based monitors and comparing the results against health records, epidemiologists can learn what volumes and mixtures of pollutants are linked with certain health problems, including pregnancy complications and cancers.
By tracing pollution back to its sources—and mapping its impacts on health over time—TEMPO’s scientists hope the data could lead to policies that save lives, improve economic productivity, and reduce health-care costs and inequalities.
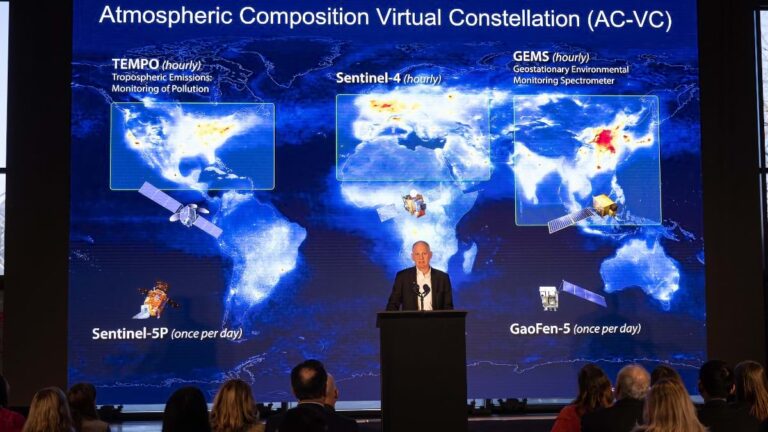
When TEMPO’s first images emerged in August, National Aeronautics and Space Administration (NASA) administrator Bill Nelson hailed the project for its potential to enhance awareness of deadly pollution and help combat it. “Neighborhoods and communities across the country will benefit from TEMPO’s game-changing data for decades to come.”
It was TEMPO’s principal investigator Kelly Chance who in 1985 first proposed with several European colleagues the advance in space-based spectroscopy—using ultraviolet and visible light—that would lead to the mission’s powerful sensor.
And TEMPO represents more earthly breakthroughs too: It’s the first instrument in NASA’s Earth Venture program, which is focused on innovative “science-driven, competitively selected, low-cost missions.” The agency gave TEMPO the green light in 2013, and construction began at Ball Aerospace (now BAE Systems) in Boulder, Colorado, with a launch target of 2018. After a series of delays, the instrument was sent aloft on April 7, 2023, aboard a Falcon 9 rocket, attached to Intelsat 40e, a communications satellite built by Maxar. NASA said it expected total spending for the project to reach about $210 million.
The mission itself is only funded to last 20 months after its commissioning phase. But Liu said the team is now working with NASA to extend the mission as part of a normal extension review process; Intelsat has told the space agency it intends to keep TEMPO’s host satellite in orbit for as long as 15 years. “Hopefully, we should be able to operate for 10 to 15 years, as long as the instrument is working,” Liu said.

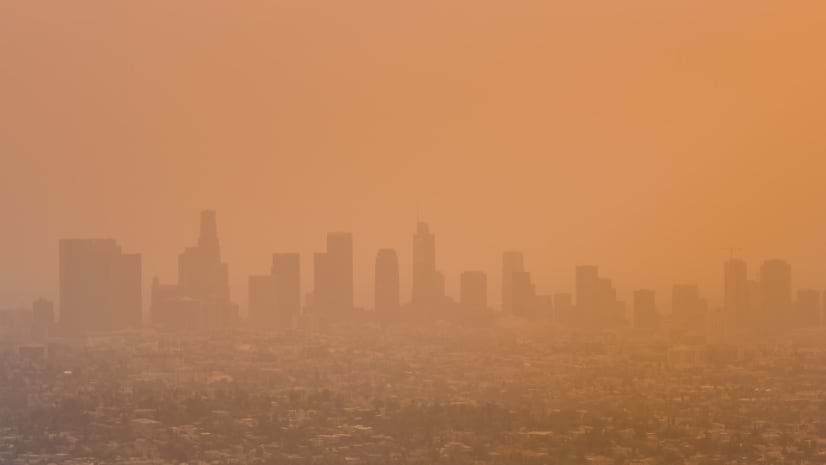
In many ways, the decades-long fight to improve US air quality, ignited by the passage of amendments in 1970 to the Clean Air Act, has been a resounding success story. But even before last summer, improvements in US air quality started to plateau. Wildfires, which are becoming more frequent and more intense due to climate change, appear to be the main reason for this reversal, thanks to fine particulate matter and higher ozone pollution. Ozone pollution, which often spikes after rush hour, has remained stubbornly high in some places, especially major cities.
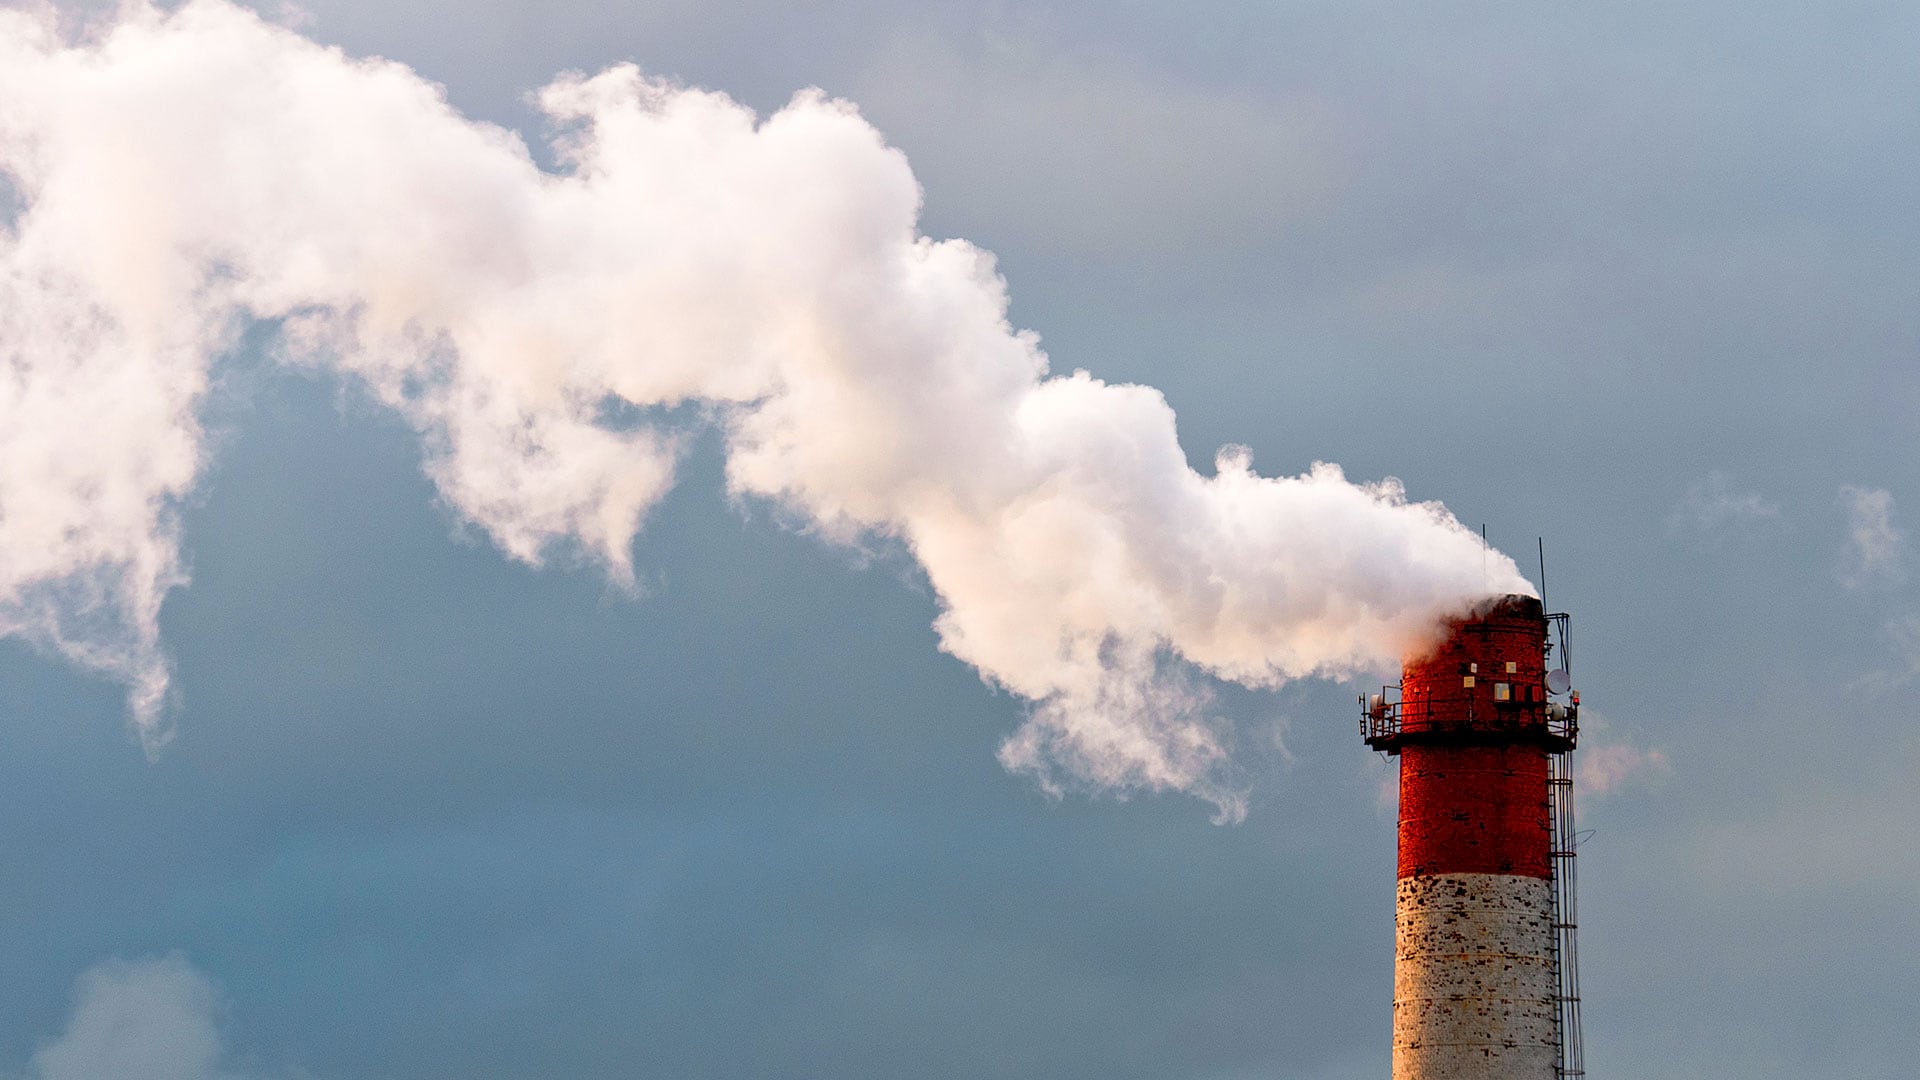
Nitrogen dioxide (NO2) is the major culprit. Emitted by the burning of fuel and wildfires, industrial activities, and agricultural fertilization, NO2 is a key ingredient in ozone pollution and fine particulate matter. Ozone high in the atmosphere—the ozone layer—protects Earth from dangerous solar radiation, but ground-level ozone, a main ingredient in smog, aggravates respiratory diseases.
And as it moves through the air, NO2 can be particularly hard to measure with existing monitoring stations. That point was driven home in June, when TEMPO was powered on. That same day, Liu got an alert from the Smithsonian Institution as the smoke of Canadian wildfires descended on Washington, DC, and other cities across the northeast.
On one hot July day, thousands of miles below TEMPO, on the streets of New York, teams of field researchers helping validate and enhance TEMPO’s data—and armed with apps and a backpack full of sensors—confronted the threat in person. For eight hours, they tracked (and breathed the air within) a 1.5-mile-high plume of ozone moving downwind across Long Island Sound and the Connecticut shoreline, at pollution levels above what the EPA deems hazardous.
“A lot of pollution can be transported from the source region a long distance, affecting the chemistry and pollution somewhere else,” Liu said.
The other major threat PM2.5, made of microscopic particles that can enter the bloodstream and cause heart and lung disease, strokes and even premature death. After years of decline, PM2.5 started increasing again around 2016. When AQI values for NO2 or PM2.5 are above 100, air quality is unhealthy, according to the EPA—first for certain sensitive groups of people and then for everyone as AQI values get higher.
TEMPO can’t directly measure PM2.5. And it has other limitations too, Liu points out. Pollution varies by altitude, but TEMPO only measures the columns of air it can detect from above. And it doesn’t work with cloudy skies or at night. (In the dark, TEMPO will be used to measure light pollution.)
Still, TEMPO’s more precise data on location and chemistry will help build better pollution models and forecasts. Ongoing advances in artificial intelligence could extend the data even further, Liu said. “There’s a lot of interest in using AI and machine learning algorithms [with TEMPO data] to produce source concentrations of PM2.5 and ozone at the surface—the air quality index—more quickly and efficiently.” Still, he cautions, “this process probably is going to take some time.”
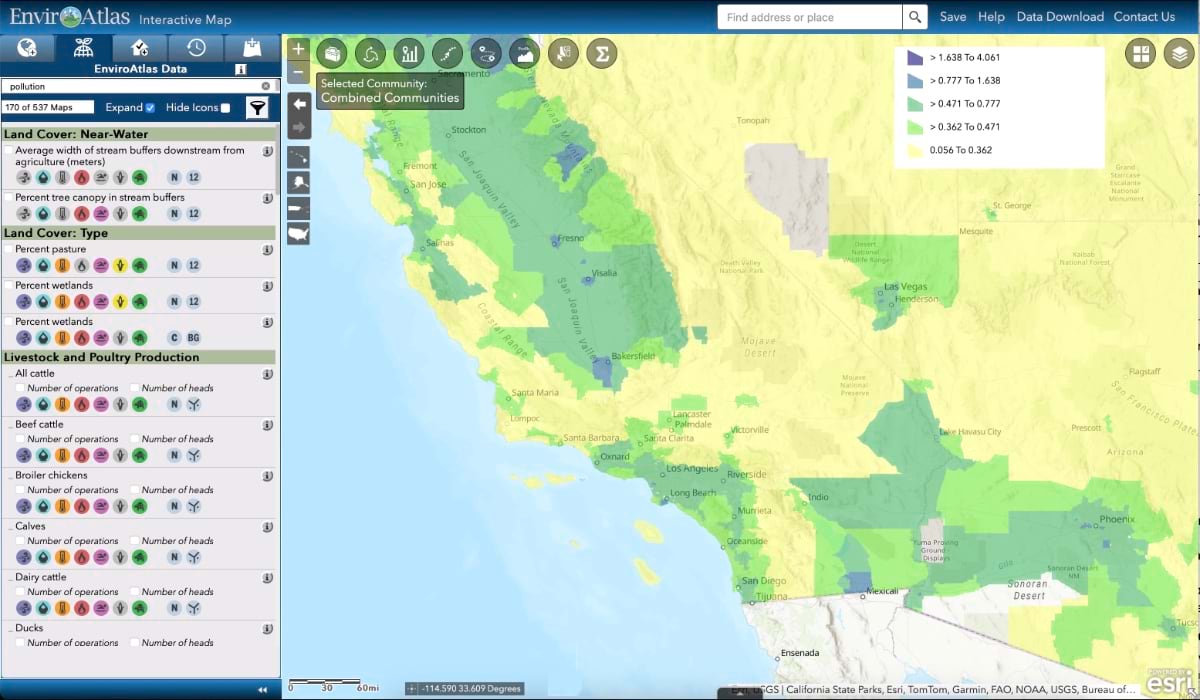
TEMPO’s first beta data product of radiance spectra was released in February. According to Liu, the major release of the TEMPO trace gas data product happened in April 2024, with additional data planned for the coming years. TEMPO data is now available via the ArcGIS Living Atlas, along with distribution through NASA’s Atmospheric Science Data Center website and NASA’s Earthdata Search, Worldview and other tools. TEMPO data will also be accessible via the US EPA Remote Sensing Information Gateway (RSIG) data tool, which allows users to select large datasets from satellites, models, and in-situ sensors; distribute the data, integrate those datasets into a unified visualization, or export them for further analysis into tools like geographic information system (GIS) technology.
As he and his colleagues race to prepare more of the data for public release, Liu said they have been encouraged by a vibrant community of more than 600 early adopters, including federal, state and local agencies; public health organizations; and nongovernmental organizations (NGOs). They have been helping the TEMPO team validate the data and provide feedback as they prepare to use it for research into atmospheric science and public health.
TEMPO will also form part of a growing virtual constellation of geostationary air quality satellites in the Northern Hemisphere, joining South Korea’s Geostationary Environment Monitoring Spectrometer (GEMS), launched in 2020, and the European Space Agency (ESA) Sentinel-4 satellite, which is set to launch in 2025 (see sidebar). Still, most of the global air quality map remains blank, with gaping holes in observations from space over South America and Africa. Liu and other scientists have recently been pushing for TEMPO-like instruments over the Middle East and South Africa. “Currently there’s a lot of community interest to push for similar measurements in the global south,” he said.
Polluted skies kill millions every year, but Liu said he detects something else in the air too. More people are paying attention to the skies, checking their weather apps, and asking questions. Instruments like TEMPO are poised to accelerate all that. “With respect to air quality and greenhouse gas measurements,” Liu said. “I think we’re actually in a prime-time period.”
Learn more about how imagery and remote sensing are integrated with GIS.

August 31, 2023 |
April 7, 2020 |
August 21, 2023 |