At Oklahoma-based engineering consulting firm Meshek & Associates, GIS manager Michael Couch and his team know a thing or two about helping communities that have little more than a goal and a tight deadline to complete complex GIS projects. The firm, an Esri partner, supports a multitude of municipalities across Oklahoma with their water, sanitary sewer, stormwater, flooding, and emergency management needs.
Some of the water, sewer, and drainage infrastructure in Oklahoma predates the state’s even achieving statehood in 1907. In dealing with municipalities of varying sizes and capabilities, with infrastructure that varies significantly in age and form, it helps that the GIS team at Meshek can be creative in delivering solutions. The ArcGIS system—including ArcGIS Online and ArcGIS Field Maps—is central to that flexibility.

A Range of Asset Inventory Systems
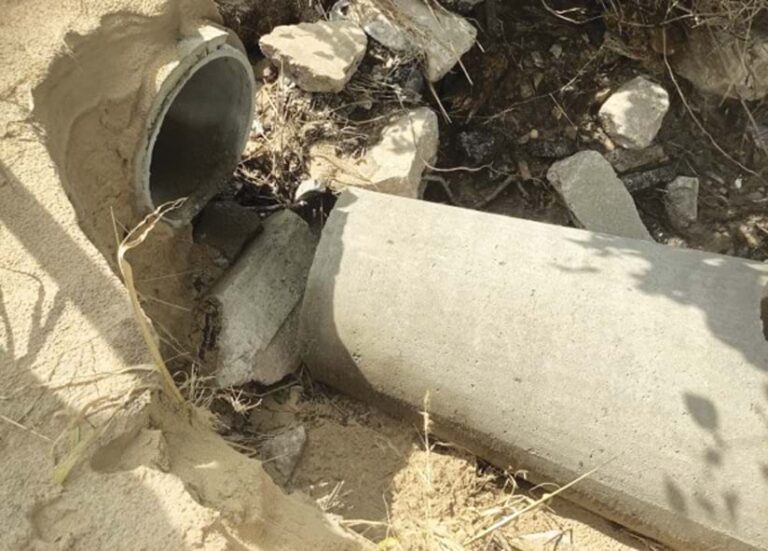
Many of Meshek’s clients have no digital data for their infrastructure. Clients often only have handwritten notes and aging paper maps that show where their assets are. Other customers rely on an assortment of spreadsheets and fragmented computer-aided design (CAD) files from various years. Some clients have no formal records of their assets at all; instead, key information resides solely in the mind of a single worker. This, of course, presents great risk if that worker were to quit or retire, leaving these organizations scrambling to quickly create a digital inventory of their infrastructure.
Whether starting with no records at all or trying to connect disparate pieces of existing information, the GIS team at Meshek uses ArcGIS technology to record asset locations and details, following a process that has proved to be both efficient and effective. Depending on the resources that clients have at their disposal, this process can involve training municipal staff members on how to use GIS to capture and update asset data both in the office and in the field. Other clients have the team at Meshek do all the data collection and receive a fully documented, ready-to-use map and digital inventory of their system. In both types of situations, Couch and his team employ Field Maps, since it is an easy-to-use, comprehensive solution for mobile work.
“Being able to go out and locate and inspect features is something that Field Maps is ideal for,” Couch said.
A Faster, Better, and Easier Process
The communities that Meshek works with use GIS to meet their specific needs, whether that’s demonstrating regulatory compliance; assessing economic development opportunities; preparing for and recovering from natural disasters; or improving the routine management activities associated with water, sewer, and stormwater systems. Therefore, scoping out a project is often the first hurdle that the GIS team must surmount.

“One of the challenges is that so many [municipalities] are reliant on pen and paper or things in the memory of staff,” said Couch. “That’s how they have always done it. But they can do it faster, better, and easier using ArcGIS Online.”
The city government of Catoosa, just outside Tulsa, provides a case study for how to go from a paper-based asset inventory system to a GIS-based one.
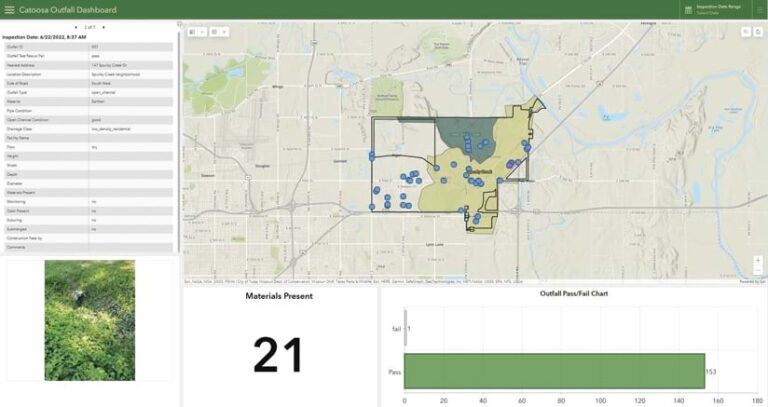
“For the City of Catoosa, we were able to take a completely paper[-based] process for stormwater quality outfall inspection and make it all digital using Field Maps,” said Couch.
Prior to working with Meshek, the city completed annual inspections of its stormwater assets by printing out a stack of inspection forms and maps and having city employees walk the terrain to locate and identify the assets. The employees would mark the asset locations on the maps and make handwritten notes of the inspection results. Back at the office, someone would manually input the inspection results into a digital form.
“But now, Catoosa has a digital inventory of its stormwater outfall system that accurately reflects [the assets’] locations and can be used in annual inspections,” said Couch. “This can all be done within one single app on mobile devices. The city was thrilled to be able to see the data so rapidly.”
Digital Data Aids in an Emergency
Some of the GIS implementations that Meshek has helped put in place have paid dividends to municipalities at critical times.

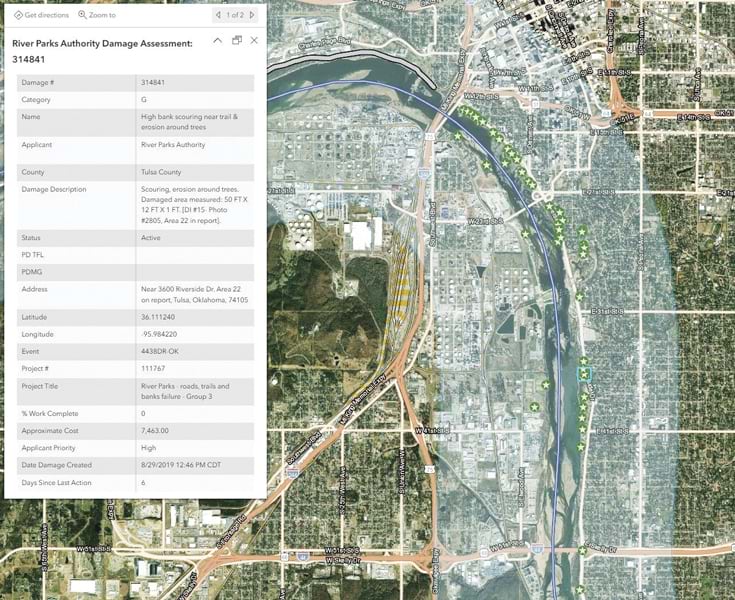
For example, Couch and his team worked with the City of Tulsa for several years to move its asset inspection process to GIS. When historic floods struck the region in May 2019, the city’s GIS-based field data collection efforts proved extremely valuable, according to Couch.
The flooding caused five fatalities and an estimated $3 billion in damage, according to the National Centers for Environmental Information. Most of the destruction occurred along the Arkansas River and not within the city proper, thanks to Tulsa’s history of investing in flood risk mitigation strategies. As is typical after a natural disaster, the city had to submit claims to the Federal Emergency Management Agency (FEMA) to get federal funding to fix the damaged infrastructure around the river.
“Communities submitting claims must prove that the damage was from the disaster and not a lack of maintenance or something else, which often can’t be done because of a lack of records,” Couch said. “In this case, the city could [prove it].”
By 2019, Couch and his team had captured a significant amount of inspection data about the conditions of Tulsa’s storm sewers, including outfalls to the Arkansas River. Because the digital records showed system conditions both before and after the floods, the city was able to substantiate its FEMA claims and receive funds to repair and restore the damaged infrastructure.
“We had all this inspection data, and we could say, ‘This is what this exact feature looked like a year ago and two years ago,’” Couch recalled. “We had photos and videos linked to the features that showed that, before the flooding, a feature was in good shape [and] wasn’t ruined or scoured away. We were able to prove that the storm caused the damage, and that was helpful to the city.”
Small Municipalities See Big Gains
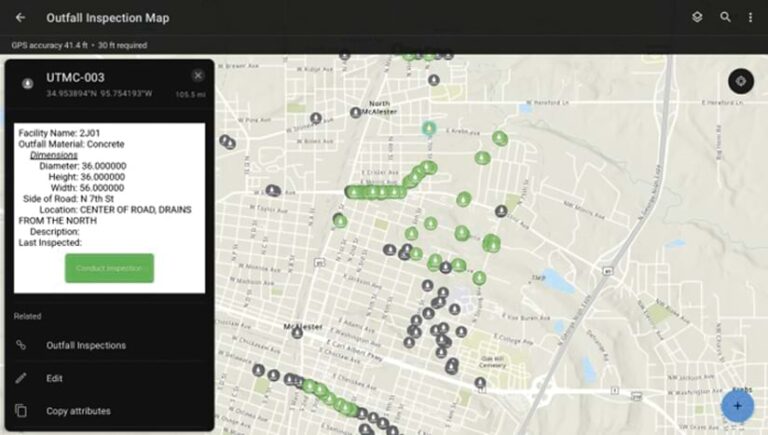
For smaller municipalities with limited staff, the benefits of having a GIS-based system of record and engagement are multifaceted. For McAlester, a city in southeastern Oklahoma with a population of just over 18,000 people, using Field Maps to digitally document water, sanitary sewer, and stormwater infrastructure was pivotal.

The paper-based system that the town relied on before was riddled with errors and inefficiencies, according to Couch.
“Once we deployed workflows using ArcGIS Field Maps and ArcGIS Online, a mobile worker could find and document an asset that had previously been marked 40 feet in another direction,” Couch said. “They’re able to just move that feature in their mapping [app] exactly where it should be because they’re standing on it.”
In addition to boosting accuracy, having digital maps of water infrastructure that are fed by reliable data has enabled the City of McAlester to be more efficient and improve correspondence with third parties. City staff are now using web apps created with ArcGIS Experience Builder and ArcGIS Web AppBuilder to share utility asset locations with contractors to minimize accidental damages during construction.
A Record of Success
The flexibility and scalability of the ArcGIS system have enabled Meshek to provide many GIS-based water infrastructure solutions to a wide range of customers with a record of success.
“If you can do it on a clipboard, you can do it in Field Maps so much easier, with [such] better record keeping,” Couch concluded.

