Many colleges, universities, and high schools are adding course offerings in GIScience. GIS certificate, degree, and professional master’s programs are starting up everywhere in response to the continuing demand for trained professionals who understand the technologies and techniques of GIS.
To be competitive on the job, students need to learn more than just the sequence of commands within a software platform that will produce a model, tables, or other output. The best preparation for students entering the GIS marketplace revolves around three fundamental elements. The first is critical thinking—understanding which GIS and statistical methods solve a given problem when multiple alternatives are available. The second is responsible use of data, which includes understanding data error or uncertainty and data management. The third is visualization and graphic design for effectively communicating GIS results using maps and graphics.
Nearly every GIS operation begins and ends with a map, an image, a chart, or some type of graphically presented data, and best practices for designing all these visuals fall within the scope of a cartography class.
We must educate GIS professionals on how to design, create, and use maps effectively—and not as a sidebar to other topics but as a primary focus on concepts, skills, and aesthetics in and of itself.
When famed GIScientist Roger Tomlinson was asked at the 2013 University Consortium for Geographic Information Science (UCGIS) what the real power of GIS is, he answered with a smile and said, “GIS gives us the ability to ask and to answer questions about our world using well-made maps with data of known reliability.” Because maps (and graphics) are the foundation for so much of what is accomplished in a GIS environment, we must educate GIS professionals on how to design, create, and use maps effectively. And not as a sidebar to other topics but as a primary focus on concepts, skills, and aesthetics in and of itself.
Cartography is a fundamental need in any GIScience degree program. Ideally, students should complete a hands-on technical introduction to cartographic design and implementation prior to enrolling in GIScience courses.
The University of Colorado Boulder (CU) follows this curricular plan. Every undergraduate geography major is required to take the introductory cartography class called GIScience Mapping as well as an introductory statistics class. GIScience majors must complete these two classes before they can enroll in their first analysis-based GIS class. After finishing those three courses, students can enroll in several GIScience electives that cover topics including modeling, spatial programming, web mapping, and project management. The university’s undergraduate certificate in GIS and Computational Science has similar requirements.
Four full-time faculty members teach the curriculum. This staffing level and curricular design falls in the middle of what’s offered elsewhere—some schools have more courses and faculty; some have less. Even with only one or two instructors, every GIScience class can and should incorporate cartography into exercises. Grading for all GIS assignments should include comments on map design and visual logic. All the CU courses are taught using ArcGIS technology, along with open-source packages such as Python, RStudio, and Jupyter Notebook.
What should be part of a cartography course today? Basic skills, such as working with map scale, projections, symbolization, and typography, can be coupled with discussions about humans’ visual abilities. For instance, a professor could introduce Jacques Bertin’s system of visual variables and Cynthia Brewer’s advice about color alongside examples of optical illusions that might cause people to misinterpret a graphic display. Examples of dynamic graphics—such as map animations, terrain flyovers, dynamically linked data views, immersive spatial displays, interactive web mapping, and augmented reality (AR)—help students grasp what can be accomplished with well-designed maps and graphics.

Cartography skills can support a basic understanding of spatial dependence (following Waldo Tobler’s First Law of Geography that closer things tend to be more similar than distant things), scale sensitivity (how changing scale or resolution can impact the appearance of geospatial information as well as spatial relationships), and that errors and uncertainty vary across every geospatial dataset and, thus, every map. In a cartography class, students will come to realize that these characteristics vary across data layers, too (for example, terrain and water are more scale sensitive than vegetation or administrative boundaries).
The CU cartography course includes weekly lecture and lab periods. In the first part of the term, students complete thematic mapping exercises as they learn to navigate the ArcGIS interface. Each exercise is tied to a scenario—for instance, designing an evacuation map to help people avoid flooded areas following a storm surge. Students are provided a digital elevation model (DEM), a transportation network, a landmarks data layer, and a storm surge polygon. Their task is to select schools, churches, and hospitals; overlay the various layers; and determine a set of seven landmarks that will lie outside the storm surge and can be deemed safe sites along evacuation routes.
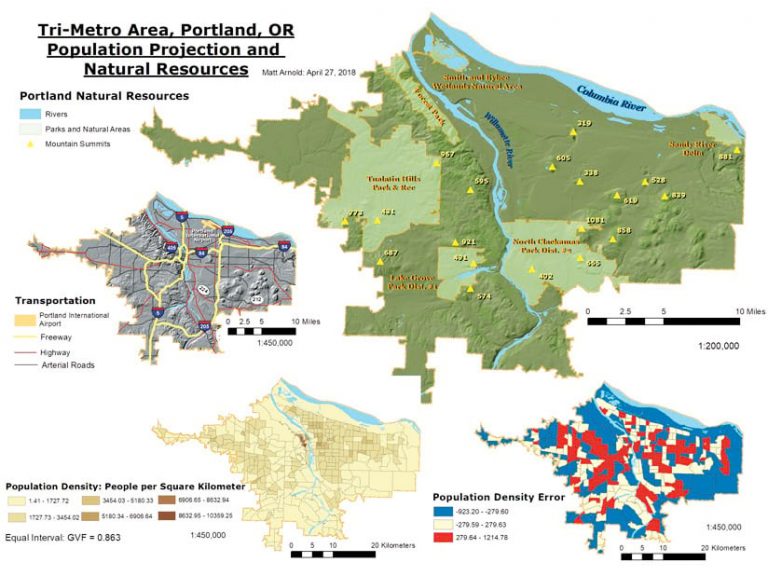
In the second half of the course, students build a geodatabase to design a multipanel map, to be presented at a fictitious town council meeting, that shows natural recreation opportunities and population density. They learn to process one layer of data each week (i.e., resample the terrain and generate a hillshade, select and label spot heights, simplify river and stream features, bind type along curved features, and place road and interstate labels appropriately). Students add processed layers to the geodatabase each week. Instructors provide US Census data and teach students choropleth mapping, metric data classification, and residuals analysis. By the end of the course, students have learned geodatabase creation and organization; worked in ArcCatalog; learned the differences between topographic and thematic map design; and established confidence in using ArcToolbox and the map layout functions in ArcMap. They are then ready to move on to modeling, topology, and data editing in the GIS analysis class.
So what can a GIS educator do who is beginning to teach GIScience and wants to teach best practices? Our advice is to start small and grow your curriculum. In 1996, when Barbara Buttenfield arrived at CU, the GIS curriculum was essentially a blank slate. A single class taught the older ARC/INFO command line interface, and a single cartography class used only graphics software. The faculty at CU built the curriculum one step at a time, one instructor at a time, before instituting an undergraduate certificate program. Recently, we added a graduate certificate program that is evolving into a professional master’s program. Along the way, we’ve received great data, technical support, and advice from many Esri staff and managers.
And if you’re aspiring to enter a career in GIS, how can you strengthen your skills? Develop a strong set of cartographic abilities, including good data management and map design. Also gain confidence in communicating the results of your work in map form!
For more information about GIScience curriculum, email CU geography professor Barbara P. Buttenfield at babs@colorado.edu and/or CU geography instructor Sarah M. Kelly at sarah.kelly@colorado.edu.


