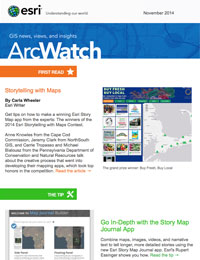
People who want to find fresh produce and fish from Cape Cod, Massachusetts, can turn to An Esri Story Map app from the Cape Cod Commission: Buy Fresh, Buy Local Cape Cod, the grand prize winner in Esri’s 2014 Storytelling with Maps Contest.
The mapping app from the Cape Cod Commission publicizes the Buy Fresh, Buy Local program managed by the Cape Cod Cooperative Extension. The app shows the locations of farmers’ markets that sell vegetables, eggs, jams, and other foods produced on Cape Cod. It also displays farms, restaurants, and quaint inns along with businesses that sell seafood caught in local waters. Buy Fresh, Buy Local is a national movement, with chapters across the United States.
What makes a good Story Map app, especially winning ones like Buy Fresh, Buy Local Cape Cod and the 19 others honored in the competition? Being imaginative, choosing the proper Story Map application, paying attention to detail, thinking outside the box, and having a strong interest in or passion for the topic, say several contest winners and a judge.
“If you are passionate about the subject, it can really get the creative juices flowing,” said Rupert Essinger, an Esri product engineer who served on the contest judging panel.

Imagining a City in 3D
Interest in the architectural plans to redevelop earthquake-damaged downtown Christchurch, New Zealand, infused Jeremy Clark of NorthSouth GIS in New Zealand with the creative spirit to design the Story Map app Christchurch Central Recovery Plan. His Story Map app included 3D web scenes of an entertainment and sports stadium, a hub for health research, a cricket oval and other venues, and an accompanying map with text, all created using Esri CityEngine, ArcScene, and ArcGIS for Desktop. Clark’s entry won first place in the Culture/History/Events category of the Storytelling with Maps Contest.
“For me, what was important was to choose a story I was passionate about,” said Clark, a GIS consultant. “Obviously you are not always going to have that choice. But in this case, it was very easy to tell a compelling story because I knew my content matter so well.”
NorthSouth GIS, a geospatial consultancy, is currently working with the Canterbury Earthquake Recovery Authority (CERA) on plans to rebuild portions of Christchurch after two high-magnitude quakes struck the area in 2010 and 2011.
Clark made the Story Map app to convey to the staff at CERA what NorthSouth GIS can accomplish with 3D visualization in urban planning to show the draft designs. “For a lot of people, 3D is a big black box,” he said. “And they don’t understand how easy, difficult, or otherwise it is [to do]. [The Story Map app will] allow people to understand what we can do with 3D in the modern era.”

Essinger said Clark’s entry demonstrated that a Story Map app can be a wonderful tool for communicating information to a project’s stakeholders. He was impressed that Clark included a three-minute video, How to Get the Most Out of This Map, inside the Story Map app.
Clark said that throughout the process, he tried his best to make the information he presented easy for his audience to grasp and suggests other Story Map app makers do the same, especially since many viewers may not be GIS users. He said there were several times he redid portions of the web scenes to better convey the information.
For example, Clark decided to use the ‘autoplay’ function in CityEngine, which gave viewers an automated 3D tour of all the Christchurch projects, including a central library and a performing arts precinct. There was no need for them to understand how to use GIS.
“I would suggest taking a bit of time when you are building it to take a look at it from a user perspective and ask yourself, What could I do to make this better?” Clark said. Listen to a podcast with Clark, where he explains in more detail how he created the Christchurch Central Recovery Plan Story Map app.
 joins John Blackburn (left) from the AMM Group, Esri President Jack Dangermond, and Mark Thompson (right) from NorthSouth GIS in New Zealand to celebrate a win in the Storytelling with Maps Contest.")
A Map to Go in Snow
Another example of a winning customized Story Map app is Winter Activities in Pennsylvania’s State Parks and Forests, designed by GIS technical lead Carrie Tropasso from the Pennsylvania Department of Conservation and Natural Resources (DCNR). She won second place in the Conservation/Environment/Sustainability category for a public-facing map of winter recreational opportunities in Pennsylvania.
The Story Map app displays where to find an array of winter activities such as ice fishing, skating, and boating; downhill and cross-country skiing; and sledding. Tabs above the map list each activity. Hovering over a symbol—a cross-country skier, for example—brings up a small photo of a park where you can ski. If you click the symbol, a topographic basemap of the area appears along with, in some cases, an outline of the ski trail. In some instances, you will find links to updated winter conditions and driving directions in the app.
“It’s pretty intuitive and has everything right in one spot,” Tropasso said.

Tropasso also made the app user-friendly by including two ways to search for parks and recreation information: a box where you can type in the name of the park, and a list of park choices. “It’s a nice touch,” Essinger said about providing two search options. “It’s a simple thing to do, and it’s not obvious,” adding that “it’s really interesting to see the customizations [users] do.”
Tropasso’s boss, Michael Bialousz, GIS director for DCNR, said he likes to use Story Map apps to share information with the public.
“We are a very visual type of agency. When we deploy information out, it’s very visual and very graphic in nature,” Bialousz said. “One of the things we like about Story Map apps is just how user-friendly they are. We have done a lot with interactive mapping over the years—we are a big proponent of that—but Story Map [apps] allow us to get a lot of that same functionality [but with] one or two clicks to the information.”
What advice would Tropasso and Bialousz give to others who want to make compelling Story Map apps?
“Think out the template ahead of time,” said Tropasso. “Each focused topic fits well into one Story Map [application] but probably doesn’t fit so well into one of the others. Look at the map gallery and see what other people are doing.”
Added Bialousz, “Push the envelope a little bit too. [The apps] are customizable.” Listen to this podcast with Tropasso and Bialousz to learn more about the technical details of building Winter Activities in Pennsylvania’s State Parks and Forests.

Branding a Story Map App
The Story Map app for the Buy Fresh, Buy Local program supports the promotion of locally sourced products, which is among the priorities of the economic development strategy for Barnstable County, Cape Cod’s regional government. Though promoting local economic development was the business reason for building the application, the motivation started with an observation. While the number of farmers’ markets has grown, determining where the produce originated wasn’t always clear.
“I was really surprised to find out how many [businesses] actually sold local produce, versus farmers’ markets that simply sold produce from elsewhere,” said Anne Reynolds, GIS director for the Cape Cod Commission.
Her vision and input helped GIS analyst Bret Whiteley design and build the app.
Essinger described the grand prize-winning Buy Fresh, Buy Local app as a “nice adaptation” of the Esri Story Map Shortlist app, one of the configurable apps available from the Story Map apps collection. For example, the standard gray banner was customized with a multicolored illustration of produce and seafood next to the Buy Fresh, Buy Local logo.
“Branding is really key. [There’s] a very specific logo that folks identify with,” Reynolds said. “It’s also a beautiful logo. It has all the elements of Buy Fresh, Buy Local in it—a basket of cranberries, a lobster, and apples.”
Essinger said that customization impressed the judges. “You are not stuck with our look and feel,” he said. “You can tailor it to match a promotion or business.”
The other winners and honorees in the contest showed creativity in customizing and displaying their story maps including:
- Adem Kurtipek, who won first place in the Travel and Destinations category for his Visit Turkey/Love at First Sight story map. He embedded Turkish music in the app. Kurtipek is from Turkey and is a visiting scholar at North Carolina State University.
- Jennifer Wahle from frox Die IT Fabrik, who won first place in the Science/Technology/Health category for her benthaus|architekten als Baukunst Map. She artistically displayed a portfolio of energy efficient building projects by the architectural firm benthaus architeckten, based in Lünen, Germany.
- Hayleigh Conway from the Centre of Geographic Sciences in Nova Scotia, Canada, who won an honorable mention for Lord of the Rings Trilogy Filming Locations. She included short YouTube clips from the Lord of the Rings movies. Her map showed where major scenes from the trilogy were filmed in New Zealand.
Allen Carroll, leader of Esri’s Story Map team, believes that Story Map apps—spearheaded by the new Esri Story Map Journal app—have enormous potential for further growth among GIS users, journalists, and the general public.
“Esri Story Map apps harness the unique power of maps to tell exciting and engaging stories about the world,” said Carroll. “The winners of our Storytelling with Maps competition represent the best of a new and rapidly growing community of geostorytellers. We hope their examples will inspire thousands of storytellers to explore this rich, new medium.”