Spatial Patterns of Disease Inspire New Ideas on Possible Causes
By Susan Harp, Esri writer
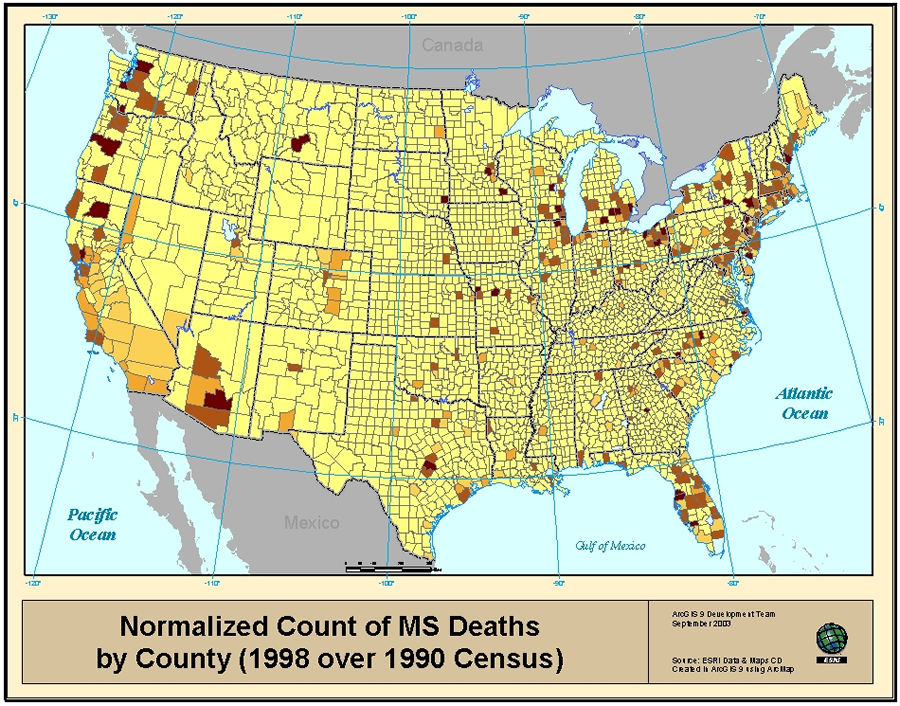 Normalized count of multiple sclerosis deaths by county for 1998 shown over 1990 Census data | |
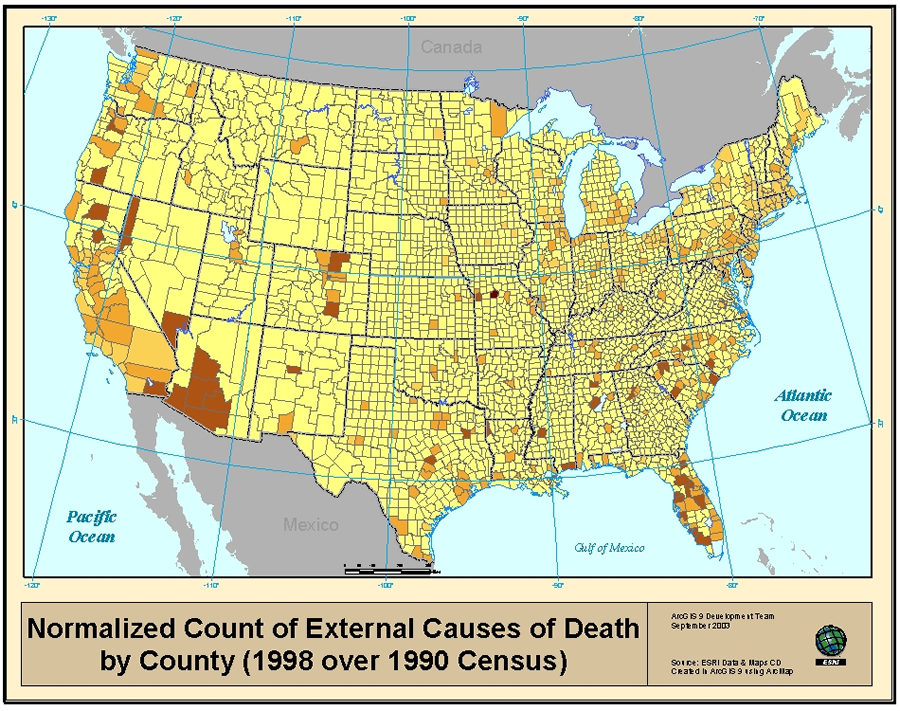 Control data: Normalized count of external causes of death by county for 1998 shown over 1990 Census data | |
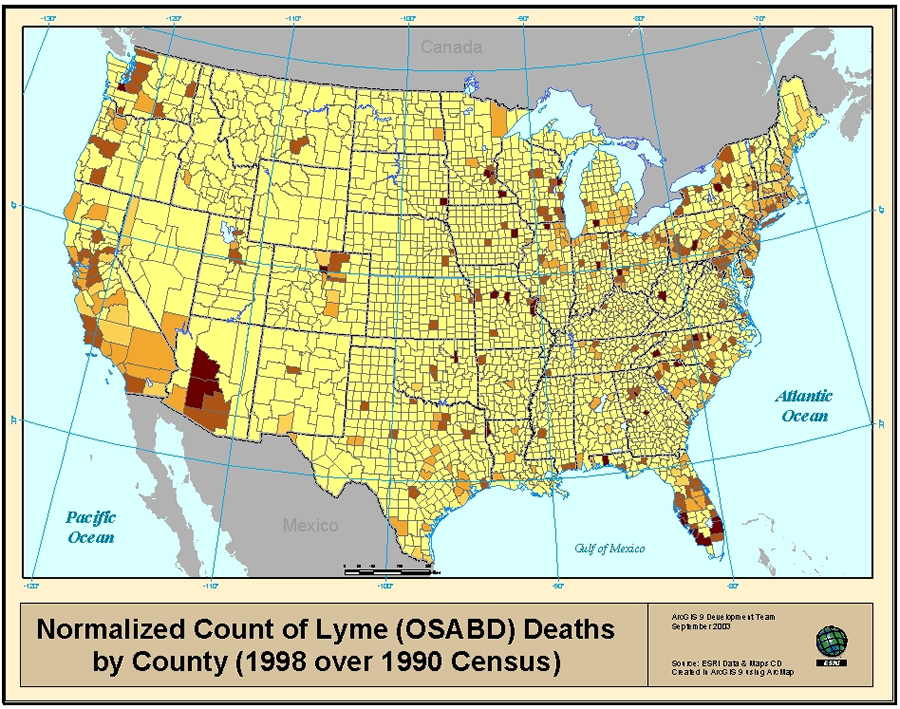 Normalized count of Lyme disease deaths by county for 1998 shown over 1990 Census data |
George de Mestral envisioned the design of the Velcro fastener in 1948 while picking burr-covered seedpods from his dog's fur after a mountain hike. As the story goes, the Swiss citizen stopped to observe the sticking qualities of Mother Nature's design and made the leap to a new, creative application. With the avalanche of information available to researchers today, the catalyst that helps produce this kind of "ah hah!" moment is extremely valuable. For Megan M. Blewett, a young 21st-century researcher, spatial geography played a role in both her "ah hah!" experience and her research.
Blewett turns 18 this year, but five years ago, she was already reading a neuroscience textbook and asking questions about a mysterious disease—multiple sclerosis (MS)—that she found described in its pages.
"I started researching MS when I was 12 and have since fallen in love with discovering the insights spatial statistics can give," Blewett says.
MS is a disease that affects the central nervous system. Its cause is unknown, but many researchers think environmental triggers might be a factor. This unsolved puzzle caught Blewett's attention. She started collecting data about MS cases in her home state of New Jersey, learning to map their distribution with GIS software and use spatial statistics tools to analyze that distribution. She also continued to read about the neurological and biochemical aspects of the disease.
However, the "ah hah!" moment came while looking at a map. Blewett explains that it occurred at a science fair while talking with one of the judges about her map of MS distribution in New Jersey.
"I just got lucky there," comments Blewett. "I was looking at a state map of MS distribution and saw that my county, Morris County, has a high incidence of MS. You could see individual towns and I knew the town next to me had a high incidence of Lyme disease." Lyme disease is a bacterial infection known to be spread by tick-borne spirochetes.
Blewett was already using ArcGIS Desktop to map MS distribution. When she started thinking about a possible Lyme disease correlation with MS, she added Lyme data to her map layers. "I saw all these correlations and results that I hadn't been able to see before and still don't think I would have been able to see if I had been using more conventional chemical research to look at individual proteins at work," Blewett adds. "Spatial statistics allowed me to see the bigger picture. Then I zoomed in to look at proteins at work in MS and related demyelinating diseases. I like to say my research path is analogous to reading the summary before reading the book."
The data collection process turned out to be one of the harder parts of the research. Data came from TheDataWeb and DataFerrett through the Census Bureau and the Centers for Disease Control and Prevention (CDC). Blewett contacted every mainland U.S. state epidemiologist asking for Lyme disease data and eventually received data from every one.
 Megan M. Blewett |
"To my knowledge, it is the largest standardized dataset of Lyme information in existence," says Blewett about the dataset, expressing a willingness to make the data available to other researchers. She subsequently ran correlation analyses using a Pearson's, Kendall's, or Spearman's coefficient, as deemed appropriate.
All variable values were converted to z-scores for use in a regression analysis. Finally, cartographic analyses compared MS, Lyme (from other specified arthropod-borne diseases data), and control from external cause of death data.
"The two disease distributions were pretty similar-they correlate and the control doesn't," explains Blewett. "Biochemically they are also very similar, so it has just taken off from there."
She hypothesizes that both diseases may share a common spirochetal basis and MS might develop from a secondary tick bite.
Blewett consulted with Esri spatial statistics expert Lauren Scott on using GIS in her research, and Scott comments, "While biologists and medical researchers investigate this hypothesis at the cellular level, Megan's work examines the spatial fingerprint of these two diseases at broad spatial scales, then tests hypotheses regarding their spatial correlation." "I wish to expand my research from a national to a global scale, while also testing my models in smaller geographic areas," Blewett continues. "A recent study suggests that MS is in fact 50 percent more common than previously predicted."
Blewett presented her work at the 2006 Esri International User Conference and participated in the Academic Fair during the 2006 Esri Health GIS Conference. This year, she was accepted into several top universities and awarded seventh place in the prestigious 66th Annual Intel Science Talent Search. For more information, contact Megan Blewett at megan.blewett@att.net or mblewett@mit.edu or visit www.msgeographics.com.