Enterprise GIS Helped Agencies Battle California's Zaca Fire
Technology Also Aided in Developing Emergency Response Plan to Protect Property and Lives
By Jesse Theodore, Esri Writer
Santa Barbara—California has a long history of fires—from the destructive blazes that were sparked by the great 1906 San Francisco earthquake to more recent wildfires in heavily populated San Diego, San Bernardino, and Los Angeles counties. In 2007, the state endured one of its most damaging forest fires in history: the Zaca fire.
 |
Daily briefings inside the Santa Barbara County Emergency Operations Center relied heavily on GIS data and GIS-based maps to show the march of the Zaca Fire toward cities and the firefighters' efforts to put containment lines around it. Photo courtesy of the County of Santa Barbara. |
The Zaca fire began on July 4, 2007 northeast of Buellton, California, in Santa Barbara County. Consuming more than 240,000 acres, the fire had the potential to displace tens of thousands of people and destroy thousands of homes in Santa Barbara and Ventura counties before being declared controlled October 29.
Fire investigators say the Zaca fire was caused by sparks from grinding equipment being operated on private property about 50 miles north of Santa Barbara. Santa Barbara County officially declared a state of emergency August 3, as thousands of acres continued to burn and the enormous perimeter of the fire moved closer to residents and their homes.
Firefighters and public safety officials from many local, state, and federal agencies worked around the clock to successfully contain the fire, prevent injuries, and minimize property loss. Geographic information system (GIS) technology helped accomplish this mission, playing a vital role as an information resource for everyone involved in responding to the fire. With Santa Barbara County setting up a GIS resource center inside its Emergency Operations Center (EOC) to provide a common operating picture and ongoing situational awareness, GIS applications were used both at the command center and at forward deployment camps. These applications included
- Continuous fire perimeter mapping
- Identification of critical facilities and infrastructure
- Allocation of resources and equipment
- Detailed evacuation planning
- Daily strategy meetings.
GIS was also used as an emergency public information resource, with GIS maps and analysis used to inform the news media and the public about the fire's location, damage assessments, road closures, and potential evacuations. Law enforcement and local government staff used GIS to plan phased evacuations and generate optimized routes.
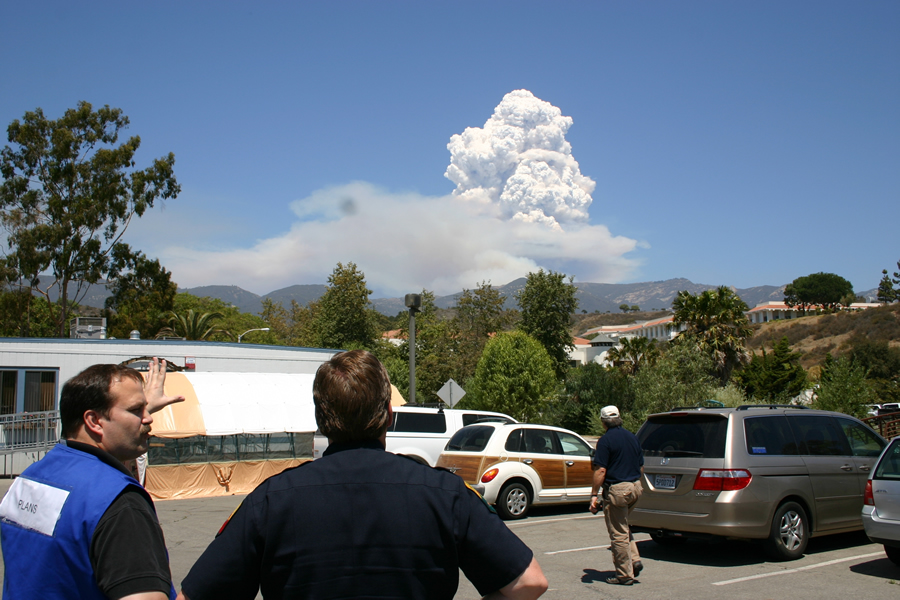 |
A giant "Pyro Ice Cloud" rises above the distant mountains as the Zaca Fire burns uncontrolled about 25 miles away from Santa Barbara County's Emergency Operations Center and media briefing tent (foreground.) The spectacle of Pyro Ice Clouds was a common occurrence caused by huge amounts of water vapor being released into the atmosphere during intense burns of trees and other vegetation. Photo courtesy of the County of Santa Barbara. |
"This really was a turning point for the utilization of GIS in an Emergency Operations Center for our county," says Zacharias Hunt, geographic information officer, Santa Barbara County. "In the past, we relied on paper maps and paper-based methods. On August 3, I was called upon to help assist with the overwhelming need for spatial information. Right away, the emergency command center needed detailed maps and information. This was the catalyst for getting our enterprise GIS up and running. It spawned a whole new set of requests for a wide variety of maps."
An Advanced Common Operating Picture and True Situational Awareness
The county GIS team quickly began to assemble data from multiple sources and generate dozens of hard-copy maps on a daily basis. With more than a dozen agencies responding to the wildfire, GIS was used to help everyone operate using the same information palette.
One of the paramount uses of GIS was providing fire staff with a common operating picture. Detailed maps displayed information used for daily briefings and strategy sessions. Data mapped with ArcGIS software from Esri included high-resolution imagery, aerial fire perimeter data, fire progression models, land parcel data, street networks, utility networks, historical landmarks, building structures, and population demographics.
Fire; law enforcement; local, state, and federal officials; the Red Cross; and others worked with a common spatial database and visualization tool for decision making and collaboration. Officials viewed and analyzed GIS data of vegetation type, landscape and slope characteristics, and wind and other weather data to predict where the fire was spreading and to determine whose homes and what property might be at risk. For instance, daily maps were generated showing the latest fire perimeter with a one-mile buffer overlaid around the perimeter. This helped staff identify structures and assets immediately threatened by the fire. Progression maps used color-coded polygons to show how the fire moved and evolved over time and place. Fire history maps showed polygons where previous fires occurred in relation to the Zaca fire. This gave officials insight into current vegetation conditions. Incident commanders could better understand what areas had light vegetation versus moderate to heavy vegetation. Moderate or heavy vegetation could provide greater fuel to the encroaching fire.
After seeing these variables in a map format, fire chiefs could determine proactive fire suppression tactics, such as where to send equipment and staff to construct firelines, conduct aerial water drops, and stage contingency resources.
Information about the locations of utility infrastructure-such as power lines, electricity towers, water lines, and gas valves-was also incorporated into the GIS database. Firefighters wanted to be sure to protect these vital power supplies to avoid service disruption. Losing power or water would make protecting life and property more difficult, could cause panic among the public, and would hinder evacuations should they be needed. County data from water and gas departments was assimilated with local utility CAD data translated into a format compatible with GIS.
Building a Cohesive, Complete Evacuation Plan
One of the more complex undertakings involved generating a comprehensive evacuation plan for the cities of Santa Barbara, Goleta, and Carpinteria, as well as adjacent communities such as Montecito. Officials were concerned the wildfire would jump containment lines and race over the Santa Ynez Mountains into the coastal areas. The federal-state-county incident management team used GIS to create digital maps and contingency plans for a comprehensive GIS-based plan dubbed The Santa Barbara County Front Country Contingency Plan. The plan was developed for evacuating more than 100,000 residents in Santa Barbara County, if necessary.
GIS-generated maps were used to assess street networks, temporary street closures, and the creation of evacuation corridors via residential streets or state highways. California state fire officials and county staff collaborated to determine when to issue an evacuation warning or an evacuation order. Looking at where the fire was, its rate of spread, and where it was in relation to the public, officials drew a perimeter for issuing warnings or mandatory evacuations. These two perimeters were plotted on the map using GIS. A reverse emergency 911 automated phone call application was in place so that if the fire reached the first evacuation warning perimeter, calls would be placed and other measures taken to warn residents and advise of a voluntary evacuation. If the second perimeter was breached, a mandatory evacuation would be issued and a phased evacuation would be carried out.
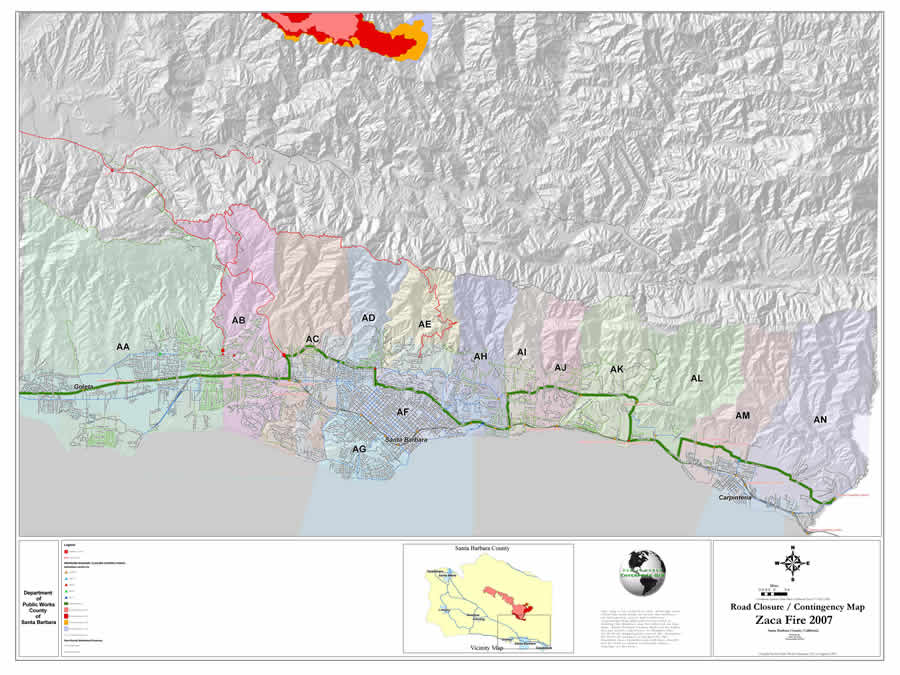 |
Santa Barbara County's Emergency Operations Center advance planners worked closely with the state's CalFire team to develop the "Front Country" plan, which focused on how to respond if the Zaca Fire spread to populated coastal areas. The plan produced this map, part of a highly detailed, multi-layered GIS database, that shows key road closure information for the South Coast area of Santa Barbara County. Photo courtesy of the County of Santa Barbara. |
The Front Country Contingency Plan also included the locations of vulnerable populations of senior citizens or disabled persons who would require special evacuation assistance. The plan contained detailed information as to where large animals were located that would need to be evacuated. It also contained the exact locations of critical infrastructure and historic buildings such as the County's 1920s era courthouse, a national historic landmark. Firefighters, many of whom were from out of town and were unfamiliar with Santa Barbara County, could use the plan to quickly determine where to concentrate their limited resources during an all-out battle against racing flames.
Hunt's use of GIS data allowed the incident commanders to divide the "Front Country" into battlefield grids that included lists of equipment, staging areas, water resources, and other data that battalion commanders would need to direct firefighters.
"They kind of collectively made that decision as far as where those decision points were going to be placed and then what the response was going to be for each of those decision points," says Hunt. "We looked at possible road closures and where we might have to control the signal for intersections. There was a big public works traffic transportation data effort to get all that spatially mapped."
Addresses of the elderly, disabled, and hospitalized people were taken from county social services databases, uploaded into ArcView, and geo-coded so commanders could spatially view where staff would need to go into the community and help assist in re-location if a required evacuation took place.
The known locations for horses and other livestock were also collected and mapped to help assess where temporary animal shelters could be placed.
"It was a three-pronged spatial data approach," says Hunt. "We looked at road closures and routing, vulnerable populations, and critical infrastructure. We then looked at where we could place medical staging areas, ambulance staging areas, and temporary shelters. We took into account where critical infrastructure like water, electricity, and roadways were located to pick the best places for those areas."
The GIS technicians assisted incident commanders with twice-a-day briefings, which brought together government staff, the media, and political leaders. The GIS analysis presented during the briefings was based on emergency responder requests and the specific, daily needs at the incident command post.
County GIS staff developed a grid system consisting of a one-mile-by-one-mile cell captured on an 11-by-17 hard copy print-out that could be handed out to crews that were going out into the field and dealing with potential evacuations and the fire threat. The grid system was created for the entire South Coast County area. The support grid utilized spatial layers developed by the county; it was also tied in to the California Fire geographic requirements for the branch and the divisions.
In addition, digital and paper fire maps that showed the fire perimeter, fire progression, fire breaks, and property data helped inform communities about what was occurring. This data was provided in digital map format available from the county Web site. A high-resolution map could be printed out in PDF format. A lower-resolution map was also available for people interested in seeing fire data who had limited broadband or computing capability.
These data and maps were also provided to the county's Public Information Office, and to the news media for their reporting. In addition, paper maps showing daily fire perimeters were displayed throughout the county at public buildings, shopping centers, and other locations.
"The maps were critical to helping the public and the news media understand where the fire was, where it had been and where it was likely to go," says William Boyer, the county's communications director and chief public information officer during the Zaca fire. "Not only were the maps critical to our emergency public information efforts, but they also were stunning works of art that many people wanted for historic purposes. People were offering to buy the maps from my staff as they went out to the information boards with daily updates."
"We have fantastic people in our operations that have been with the county for years and have a lot of institutional knowledge," says Hunt. "By bringing the spatial element of this knowledge to a map and having that map be part of daily internal briefings to figure out how they're going to deal with things was extremely valuable. It also helped in collaboration with other agencies that were brought in that weren't very familiar with some of the dynamics of our terrain and our coastal community. I think it was a good mix of having institutional knowledge as well as these maps and analysis that helped with outside people and agencies helping in the response. It got everyone on the same page as far as what the plan's going to be."
For more information, contact Zacharias W. Hunt, geographic information officer, County of Santa Barbara at zhunt@co.santa-barbara.ca.us.
See also "GIS Teams Map the Zaca Fire."