October - December 2007
October - December 2007 |
||||||||
|
|
||||||||
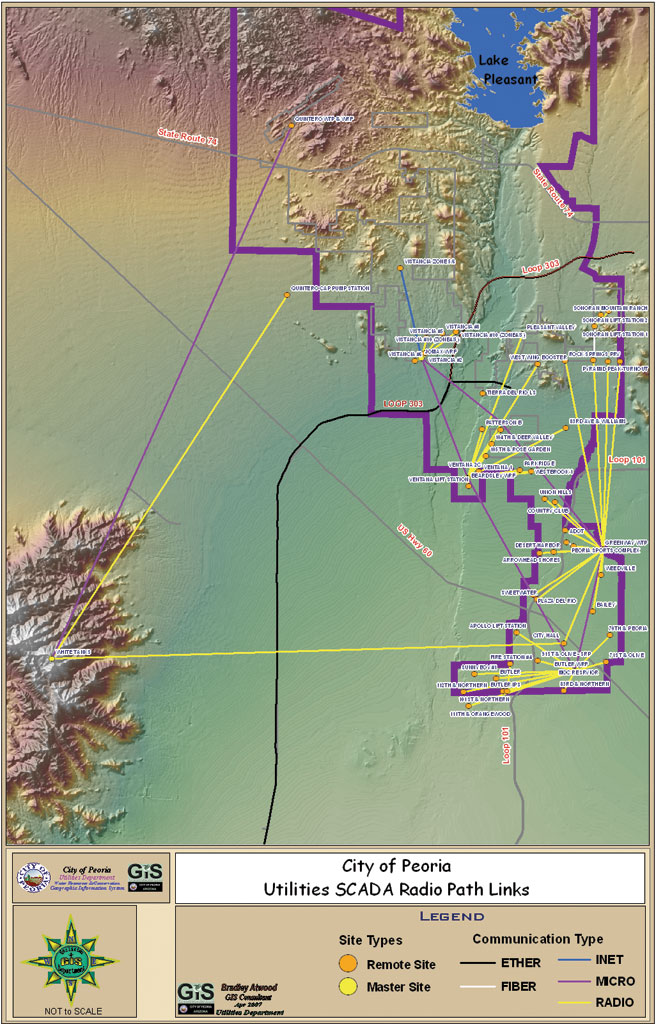
Situated in the northwest Sonoran desert and on the outskirts of the booming Phoenix metropolitan area, the city of Peoria, Arizona, was identified in the 2000 Census as the fifth fastest growing city of cities with populations of more than 100,000 in the United States. The city's population has grown 65 percent in the last decade and is expected to have more than 350,000 residents in the next 20 years. To meet these growing demands, the city's Utilities Department obtains water from two water treatment plants and 35 wells and treats its wastewater at two water reclamation facilities with a third facility under construction. The Utilities Department maintains and operates 137 satellite complexes and more than 1,600 miles of water and sewer pipelines and other infrastructure. Peoria uses a SCADA (i.e., Supervisory Control and Data Acquisition) computer system to monitor and control its water plants and remote well locations. Real-time operational information is transferred back to a central command site using serial radios arrayed in a star formation wide area network. Peoria is currently upgrading its SCADA system to Phase II by replacing its serial radios with broadband Ethernet radios. Replacing the current single access point will be a new ring network that will have at least five master radios providing access points for remote site connectivity. Redundant connectivity is being added by installing fiber optic cable and Internet connections. A Better Way to Model Radio Paths
In February 2007, line-of-sight and viewshed analysis capabilities for doing SCADA radio path studies using the ArcGIS 3D Analyst extension were demonstrated to Peoria's SCADA steering committee. The committee also learned about the extension's ability to answer what-if questions for radio and antenna placement. The presentation concluded with information on using ArcScene, an application in the ArcGIS 3D Analyst extension, to create three-dimensional maps for analysis of future radio paths. The SCADA committee was impressed by the demonstration. Within a few weeks, the committee began submitting desired radio path studies to the GIS team in the Utilities Department. The initial GIS setup was done in a few days because the city already had high-quality aerial photos with four-inch resolution, five-foot digital elevation models (DEMs) from Maricopa County, and the locations of most of the utility assets being monitored by SCADA. Address points were used to identify residential locations. Because this was the first three-dimensional project for the city, only a small amount of structure height data had been collected. It has been an ongoing process for the Utilities GIS team to collect the z-values (i.e., elevations and heights) for the radio antennas, buildings, and obstacles along the radio path corridors. Building heights have been gathered from Maricopa County and the Peoria Planning Department from as-built drawings and field verifications.
The first studies were done using the ArcGIS 3D Analyst 9.1 extension. Deliverables included line-of-sight graphics overlaid on aerial photos and profile graphs that were enhanced with Microsoft PowerPoint graphics. Subsequent studies have been done using the ArcGIS 3D Analyst 9.2 extension. In addition to the original deliverables, studies now often include two-dimensional scenes, exported from ArcScene, that show radio path obstacles and potential solutions. ArcGIS 3D Analyst has allowed the Utilities GIS team to bring radio path studies in-house. Saving Time and Money
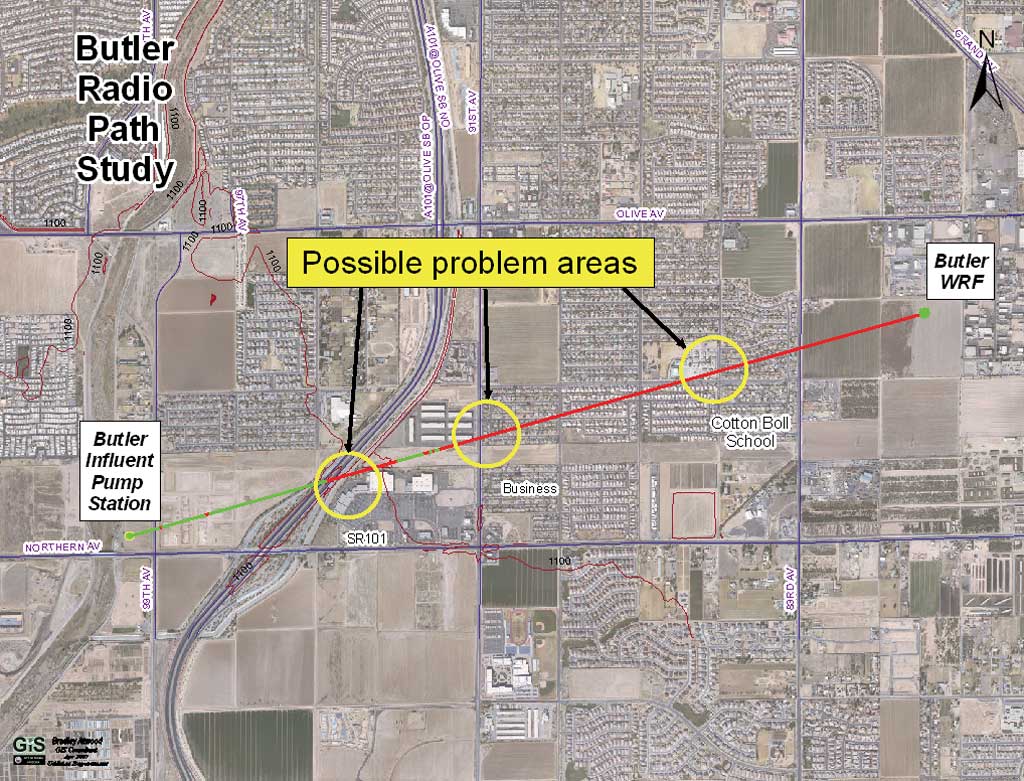
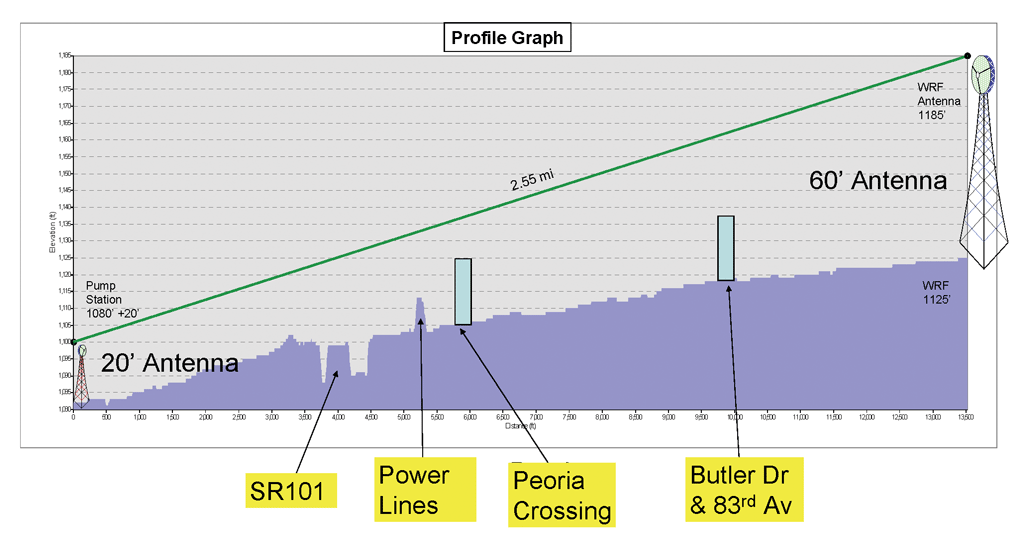
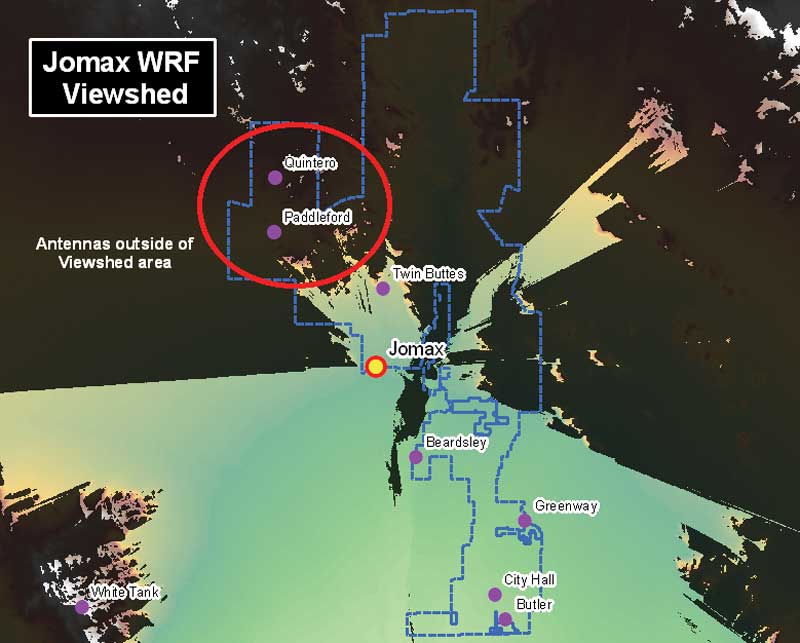
Previous external studies had been expensive. Consulting fees averaged $200 per hour. It cost the city approximately $3,000 to analyze a single radio path between two points. The external studies took as long as three months to be delivered and the quality of the work provided varied. The SCADA Phase II redesign required a complete viewshed and line-of-sight analysis for more than 56 SCADA radio towers. Using the in-house Utilities GIS team for this analysis has saved the city tens of thousands of dollars and months of time. A typical radio path line-of-sight study, with no physical obstacles found, was done in-house in less than a day. Alternate network scenarios were quickly mapped in ArcScene for easy visualization and improved decision making. When a radio path encountered multiple obstacles and generated numerous what-if scenarios, optimum solutions were still found in less than a week. Radio Path Analysis ProcessExisting and future SCADA tower locations and heights are entered into the GIS database. A radio path corridor is created, then superimposed on aerial photos to see possible obstacles such as hills, buildings, highway sound barriers, or tree stands. Any potential obstacles in the radio path corridor are entered into the GIS database. Along the radio path corridor, a line-of-sight map, profile graph, and possibly a viewshed analysis map are produced using ArcMap. Finally, the radio path is verified using an ArcScene three-dimensional map. Two-dimensional maps, showing obstacles and other features of interest, are often generated as PDFs. Subdivisions zoned for vacant or agricultural use are highlighted and identified as areas of potential future obstacles. Unexpected Benefits
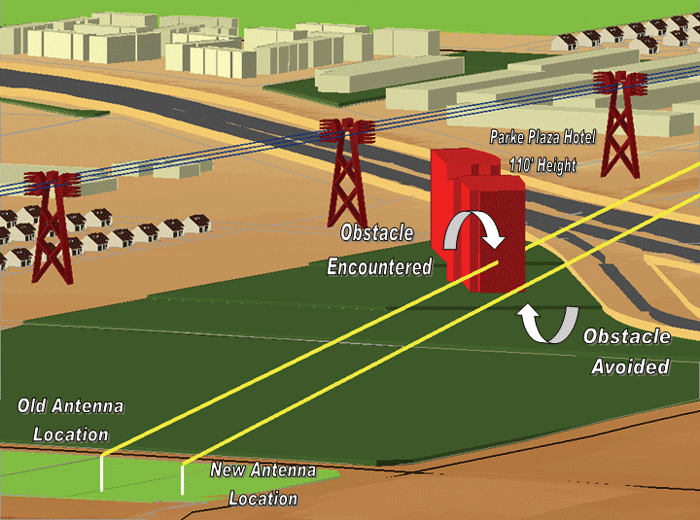
The Utilities GIS team contacted the city's Planning Department and found that a number of high-rise buildings were slated for construction in the next few years. With the use of AutoCAD as-built drawings, the Utilities GIS team created future building footprints and placed them into the city's GIS. Using 3D Analyst and ArcScene revealed that some new 110-foot buildings were unforeseen obstacles to a proposed SCADA radio path. The SCADA Committee was able to relocate the proposed antenna site at no cost to the city. In another case, a proposed radio path between two antennas was immediately ruled out when a line-of-sight analysis showed a 300-foot hill as an obstacle. A fiber optic connection to an alternate site was used instead. Types of Questions AnsweredThe Utilities GIS team continues improving its radio path analysis as ArcGIS 3D Analyst software evolves. By being proactive, the GIS team is able to answer the SCADA committee's many what-if questions reliably, inexpensively, and quickly. Some typical questions include
Conclusion
The ArcGIS 3D Analyst 9.2 extension has been an excellent tool for analyzing SCADA radio paths. The city of Peoria continues growing at a rapid pace and has saved thousands of dollars by doing the radio path studies in-house. New studies are constantly required as remote sites are completed in the northern region and new antennas are added to the SCADA communication system. In the southern region, new high-rise hotels, office complexes, medical buildings, and educational facilities are being built so established radio paths can now be identified and protected. Occasionally, when a radio path passes through a tree stand or grazes a hillside, a radio path analysis must still be conducted in the field by outside personnel. However, the majority of radio path studies are now done quickly and inexpensively by the Utilities GIS team. The accuracy of GIS analysis combined with the robustness of Peoria's SCADA radios has proved to be a winning combination. After receiving the Phase II radio path analysis from the Utilities GIS team, Phil Glass, senior application development analyst, wrote, "This is really cool stuff! It's going to save us a lot of heartache and headaches (and $$$) when we implement Phase II. Thanks!" For more information, contact
E-mail: Bill.Hoover@peoriaaz.gov Tel.: 623-773-7765 or Bradley Atwood, GIS Consultant E-mail: Bradley.Atwood@peoriaaz.gov Tel.: 623-773-5127 About the AuthorsWilliam J. Hoover, senior GIS technician for the City of Peoria Utilities Department, has worked in GIS for more than 10 years. He has an avid interest in GIS and enjoys the analytical aspects and challenges of this technology. He holds an associate in applied science degree in GIS from Gray's Harbor College in Aberdeen, Washington. Bradley Atwood has 25 years of experience as a civil engineer, senior programmer/analyst, and a GIS consultant. He has most recently been employed by the City of Peoria. |