ArcUser Online
Is Data Driving Your Fire Engine?
Finding, understanding, maintaining, and mapping spatial data for public safety
By Mike Price, Entrada/San Jaun, Inc.
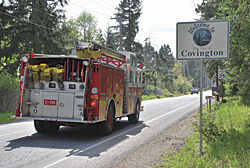
Kent Fire/Fire District 37 in southern King County, Washington, protects an area of approximately 49 square miles that encompasses urban, suburban, and rural areas. Here an engine travels to the City of Covington to a new station that provides a high service level in the eastern portion of the district.
This article as a PDF .
Editor's note: The author is the president of Entrada/San Juan, Inc., a natural resources and public safety consultancy. He is a licensed engineering geologist with more than 30 years of experience. For the last 12 years, he has been writing articles for ArcUser magazine that help GIS users understand, manage, model, and use data. Although this article targets managers of GIS data for fire departments and others involved in public safety, this data framework can be used throughout local government.
Public safety service providers everywhere are tasked with serving populations that are growing (or at least remaining static) as budgets decrease and resources become more scarce. In this budgetary environment, cost containment measures may include reducing staffing; redeploying apparatus; closing stations; and—in some cases—ceasing to serve some areas. Nonetheless, agencies still strive to provide the highest level of service through improving internal operating efficiencies, implementing interagency agreements, and creating regional authorities.
I am often asked by public safety mapping and administrative staff which datasets are necessary to perform various mapping and analytical studies. They are especially interested in the order of importance of these datasets. I keep careful notes on these essential public safety datasets and have noted which datasets provide the best value, how incorrect or inappropriate data can damage or derail a study, and what the best sources are for essential information.
In public safety, we perform many mapping and analytical tasks that include resource allocation and deployment, dynamic response modeling, historic incident analysis and reporting, and mapping of affected populations and values. These tasks combine to support large studies such as strategic, capital, master, and Standard of Cover plans. In this article, I have summarized my thoughts on and findings about public safety data. Public safety data is a very broad theme. In this article, I introduce and discuss framework data, as defined by the Federal Geographic Data Committee (FGDC).
Kent Fire/Fire District 37 is a career, rather than a volunteer, department in southern King County that protects a population living in approximately 49 square miles that encompasses urban, suburban, and rural areas. The district includes large warehouses and light industrial development. The district lies on a major north�south interstate freeway and a second high-speed arterial, and major north�south railroads traverse the city's downtown core. The district lies immediately southeast of SeaTac International Airport and approximately 10 miles from Port of Seattle's Duwamish seaport. Their fixed facilities include eight staffed fire stations and a Fire Prevention Bureau. In 2009, emergency responses exceeded 15,000 calls. Of these, approximately 76 percent were rescue and emergency medical service (EMS) calls; 5 percent were fire, explosion, and Hazmat calls; and 19 percent were service and other calls. The department serves a total population of more than 138,000 and protects assets that were assessed in 2009 at approximately $18 billion.
The Valley Communications Center (Valley Com), the region's dispatch center, is upgrading software and services. The district actively participates in the development of regional public safety datasets for deployment on mobile mapping and communication platforms.
Framework Data for Public Safety
Fire District 37 GIS technicians use current high-resolution imagery to update live maps showing parcel-based occupancies, values, hazards, and essential facilities.
FGDC, through the National Spatial Data Infrastructure (NSDI), has developed a framework for assembling and supporting geographic data on a nationwide basis to serve a variety of users. The seven key data elements identified by the FGDC are (listed in order): geodetic control, cadastral, orthoimagery, elevation, hydrography, administrative units, and transportation. These familiar datasets are typically developed, maintained, and used by public and private organizations within a specific geographic area. Public safety mapping uses data from all these framework data types.
My First Choice—Transportation
To create and maintain time-based emergency response networks, current, accurate transportation data is essential. Detailed street data that supports both time-based travel and incident geocoding is essential. Geocoding incidents also supports risk analysis by allowing historic incidents to be posted on maps. To start a study, I first look for the best available street dataset(s). Sometimes, the same street dataset will support both functions, but often two street sets, obtained from the same or similar sources, are enhanced, then maintained separately to support each task.
High-quality street data is available from commercial vendors. Reasonably current and accurate data is also available without charge from vendors and through the U.S. government. In many cases, locally constructed and maintained streets provide the most current, accurate, and adaptable solution.
For streets inside the district, Kent City Public Works maintains current streets for geocoding and, with minor enhancements, for emergency routing. For areas outside the district and throughout the South Valley, King County GIS provides regional streets. Valley Com is building a composite regional street dataset to support its dispatch and communications software implementation. County agencies provide their best street sets, which are being merged and standardized by a consultant. [For more information about network streets, download "It's All about Streets." To learn more about geocoding, check out "The Call Comes In."]
The U.S. Census Bureau is updating its MAF/TIGER Database (MTDB) for the 2010 Census. These streets should be available after they have been finalized. TIGER 2009 streets can also be downloaded. Since 2000, there have been many significant changes in TIGER streets. Positional alignment has been improved, and addressing is more complete. Although TIGER 2009 streets provide a good address geocoding reference, they do not include the network impedence values or appropriate directionality and crossing relationships needed for performing time-based analysis. While it is possible to build a network dataset from TIGER 2009 streets, it requires considerable effort and extensive local knowledge.
Second Pick—Cadastral
Next on my public safety wish list is county assessor parcel data. Parcels are constructed on the broader cadastral framework. County assessors typically use the Public Land Survey System (PLSS) to catalog and store parcel information. The availability, content, and spatial representation of assessor parcels varies considerably by jurisdiction. In the best case, attributes may include owner/occupant information, occupancy and use type, appraised and assessed valuation, and structural information. A robust, current assessor parcel dataset will support hazard and value mapping throughout a county. Obtaining this data can necessitate developing a relationship with the county assessor, which can take time and require the appropriate introductions.
Since property values can quickly change in either direction, obtaining parcel data for several years may help. Assessor parcels are a key dataset when defining and structuring agency consolidations and developing or updating an agency's revenue stream. Also, with sufficient single-family and multifamily residential information, the occupancy percentage and average family size can be estimated prior to the release of Census 2010 data.

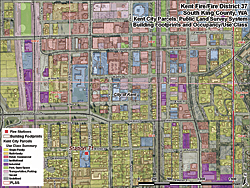
Assessor parcels, high-resolution imagery, transportation systems, and the Public Land Survey System (PLSS) combine to map parcel and building-level occupancies in the City of Kent.
At Kent Fire/Fire District 37, assessor parcels provide information about new subdivisions and construction and changes in values and building occupancies. They define and support tax rates and are used for updating the Fire Benefit Charge. Parcel data can provide a reasonable estimate of street width and define candidate locations for proposed easements and new access. This data can also provide a framework for Fire Prevention Bureau staff as they perform inspections and update prefire plans. [Fire Prevention Bureaus provide public education, inspection and code enforcement, and detailed plan review.]
There is one more use for assessor parcels: if you convert the parcel polygons to centroid points and associate the highly accurate and standardized assessor site addresses, you have an excellent, reasonably current E-911 geocoding point file! [See "The Call Comes In" in the Spring 2010 issue of ArcUser for more information on geocoding point files.]
The district uses traditional cadastral data to define and map Fire Demand Zones (FDZs) and design response zones (or Fire Boxes). FDZs are defined by quarter section aliquots in PLSS. [An aliquot part is a standard subdivision of the area of a section based on an even division by distance along the edges, rather than equal area. Half section, quarter section, or quarter-quarter section are examples of these units.] In Washington State, the PLSS is administered by the Washington Department of Natural Resources. In your state, the land subdivision could be administered by the U.S. Bureau of Land Management or other agency.
Third Choice—Orthoimagery
With street alignment and parcel boundaries on a map, the next step is checking those layers against imagery. Imagery is the third item on my list because it can be used for visually validating the streets and parcels in coordinate space. Current, high-resolution imagery is an invaluable tool for viewing and understanding many aspects of a street dataset including street alignment, lane count, intersection geometries, road width, and new construction. Aerial imagery shows the relationship between street edges, street centerlines, and parcel edges. It also shows the placement and orientation of structures on parcels. This is especially helpful when mapping and addressing apartments or condominiums that have many residential units on a single tax parcel.
At the wildland-urban interface, imagery provides a quick way to visualize fuels and measure the distances separating hazardous fuels from structures. In these areas, it is best to obtain two recent imagery sets—one with leaves on trees and one with leaves off trees.
In the district, recent, high-resolution imagery that was carefully rectified was used for validating the location, orientation, and footprint area for structures; the preferred method of access for large parcels; points of building ingress and egress; placement options for fire apparatus; and even fire hydrants. Public safety mappers are highly visual people who are continually finding new uses for aerial imagery. Kent City updates its high-resolution imagery every one or two years. In addition, a contractor provides biannual updates of registered vertical and oblique imagery. District staff is just starting to use the oblique imagery for prefire planning, building inspections, and tabletop scenarios.
Fourth on My List—Administrative Units

Current, accurate transportation data is essential to support time-based travel. Geocoding incidents also supports risk analysis.
With streets and parcels mapped and studied, administrative boundaries can now be refined. Boundaries, including county lines, city limits, fire districts, and Urban Growth Areas (UGAs) [boundaries designed to contain urban sprawl] are defined and maintained on a cadastre. The county clerk/recorder or surveyor often maintains this data at the local level. Regional boundary information may be recorded by state agencies (e.g., transportation, public lands, environmental). Federal agencies, such as the U.S. Forest Service, Bureau of Land Management, and Federal Emergency Management Agency (FEMA), can also provide boundary information.
At the Kent Fire Department, municipal and district boundaries are maintained by King County and Kent City. King County also maintains county, special district, and other boundaries countywide. Examples of special district boundaries for natural hazards and areas of environmental sensitivity are defined and maintained by the Washington Department of Ecology, Washington State Emergency Management District, FEMA, and other agencies.
The district includes regions of rapid urban and suburban growth. State-defined UGAs are essential, as they predict where and when additional services will be needed. During the 2009 reaccreditation, UGA-based growth projections provided key planning information. In a broad sense, all strategic/master plans and capital facility plans are guided by growth boundaries.
Fifth and Sixth—Elevation and Hydrography
As an old firefighter and geologist, I have combined these two framework pieces and placed them toward the bottom of the list. However, in areas with certain natural hazards, these datasets should probably be listed first. Digital terrain data, including 10-meter digital elevation data, is available nationally from the U.S. Geological Survey (USGS) Seamless data site (seamless.usgs.gov). Digital hydrography is available nationally from the National Hydrography Dataset at nhd.usgs.gov/data.html. Riverine inundation data may be previewed at FEMA's Map Service Center at msc.fema.gov. Data may be ordered from this site or it may be available without charge through your county or state emergency manager. Other terrain and water-based hazard information could be available through county or state emergency or engineering agencies.
In the district, 10-meter USGS terrain data provides a regional base. The Puget Sound Lidar Consortium provides terrain data as grids with 6-foot pixel resolution throughout the southern county. By combining high-resolution terrain with imagery, hydrography, geology, and transportation, district staff model new construction, flooding, critical slopes, winter operations, and travel slowdown on steep roadways. By combining different types of framework data, district personnel can model, understand, and solve many complex problems.
And Finally—Geodetic Control
Public safety mappers perform spatial mapping and analysis in a carefully defined and controlled coordinate-based world, though they tend not to focus on positional and spatial accuracy and instead are more concerned with getting trained personnel and sufficient and appropriate emergency equipment to incidents as efficiently and safely as possible. Behind the scenes, mapping data is carefully connected to a precise system of points and arcs that includes benchmarks, survey control points, and regional traverses. Local agencies rely on federal, state, and county agencies to establish and maintain the control net. For most agencies, the county surveyor is the resident expert.
Accurate and extensive survey control supports all that emergency response personnel do. Survey control is important and becomes more so as regional response models and communication protocols are developed. For now, public safety mappers should get acquainted with their county surveyor and engineer!
Special Data—Shape of Things to Come
This article briefly summarized seven types of framework data that are used every day by public safety mappers. There is an extensive set of essential information that does not fit directly into framework categories. Here is a short list of special data used for risk/hazard/protection/value mapping:
- Fixed and Portable Facilities (Protection)
- Apparatus
- Personnel
- Special Services
- Other Essential and Critical Facilities (Protection, Value)
- Historic Incident Data (Risk)
- Water Supply (Protection)
- Land Use/Zoning (Hazard, Value)
- Growth Management (Hazard, Value)
- Special Hazards and Occupancies (Hazard, Value)
- Industrial
- Natural, Environmental
- Cultural
- Census Demographics (Value)
- Communications, Command and Control (Protection)
Acknowledgments
The author thanks the staff and administration of Kent Fire/Fire District 37 and their contributing agencies. Special thanks to Kent City Public Works, Valley Com, and the Zone 3 mapping group. Through partnering and mutual commitment, great things are possible.