Putting the Pieces Back Together
From Crowdsourcing to Tsunami Zones, Willis Re Relies on GIS for Accurate Event Response
Highlights
- Using ArcGIS, insurance risks in a tsunami zone can be easily identified.
- GIS can help brokers find all the Flickr posts within 100 meters of an insured property.
- eNCOMPASS Online streamlines policy data capture to include addresses, not just postal or ZIP Codes.
A string of natural catastrophes since January 2010 has cost the insurance industry billions of dollars worldwide and has forced insurers and reinsurers to reevaluate their risk management and claims response processes. Willis Re, headquartered in London, England, serves the risk management and risk transfer needs of a diverse, global client base that includes all the world's top insurance and reinsurance carriers, as well as national catastrophe schemes in many countries around the world.
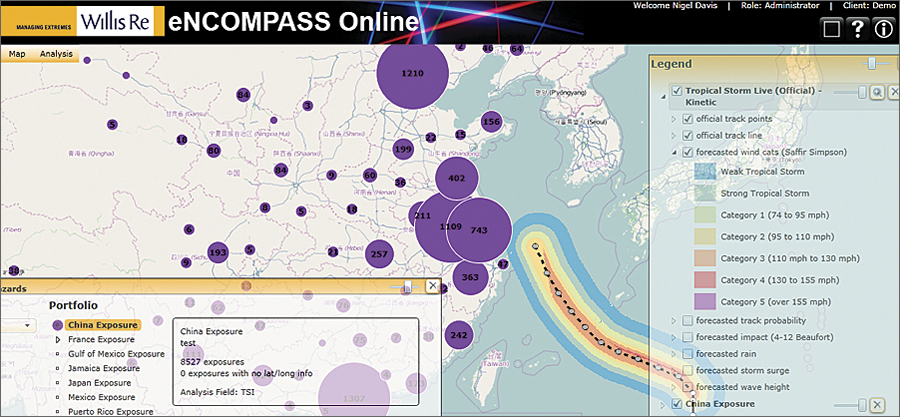
Willis Re's eNCOMPASS Online includes data that covers major perils worldwide, including live feeds like this tropical storm tracker.
Following the magnitude 9.0 earthquake that rocked Japan on March 11, 2011, and set off a tsunami, Willis Re quickly went to work gathering critical information for its insurance clients. Using an online system called eNCOMPASS, Willis Re provides data on policies and hazards and other related spatial information to its clients to view and analyze. In turn, insurers use the information to understand clients' needs, analyze potential insured losses, and pay out claims.
Preparing for the Worst
Willis Re's core focus is to provide insurance companies with a superior understanding of the risks they face. When the organization anticipated that a large number of hurricanes would make landfall last year, it was inspired to build eNCOMPASS to estimate the potential impact of large tropical storms and exposure for clients.
Willis Re's clients can conveniently log on to eNCOMPASS Online from anywhere in the world and quickly visualize all policies for locations in the path of a storm. Once the affected policies are selected, all the descriptive information associated with those policies becomes available for further analysis and action. Using this data, loss adjusters, as well as the policyholders themselves, are contacted, ensuring that response and customer service are accurate and timely.
The software on which eNCOMPASS is built is ArcGIS, which was chosen following a deliberate and intense review of potential technologies.
Willis Re is one of the first in the insurance business community to understand and implement a solution that integrates all levels and supports open access, collaboration, and transparency. It is able to do this because it has access to authoritative data and can create high-quality maps that support visualization, spatial analysis, and models through a rich application.
eNCOMPASS Online includes data that covers major perils worldwide, from flood zones in Latin America to earthquakes in New Zealand. Willis Re staff use live feeds for real-time or near real-time information on events. For example, the United States Geological Survey (USGS) live feed is used to display recent significant earthquake activity around the globe.
Events Increase Data Appetite
When the earthquake and subsequent tsunami hit Japan, Willis Re staff derived a bespoke—or custom-made—estimated representation of the tsunami zone using GIS geoprocessing, a digital elevation model (DEM), and ground observations. The DEM was derived from Advanced Spaceborne Thermal Emission and Reflection Radiometer (ASTER) sensors. ASTER provides remotely sensed terrain data that is easy to access and of a reasonable resolution (30 m) and wide coverage. Land elevation and slope were derived to analyze where inundation from water would take place. This tsunami dataset was loaded in eNCOMPASS Online soon after the event for analysis purposes. Willis Re staff also provided earthquake ShakeMaps from USGS and displayed this data on top of a world topographic map from Esri.
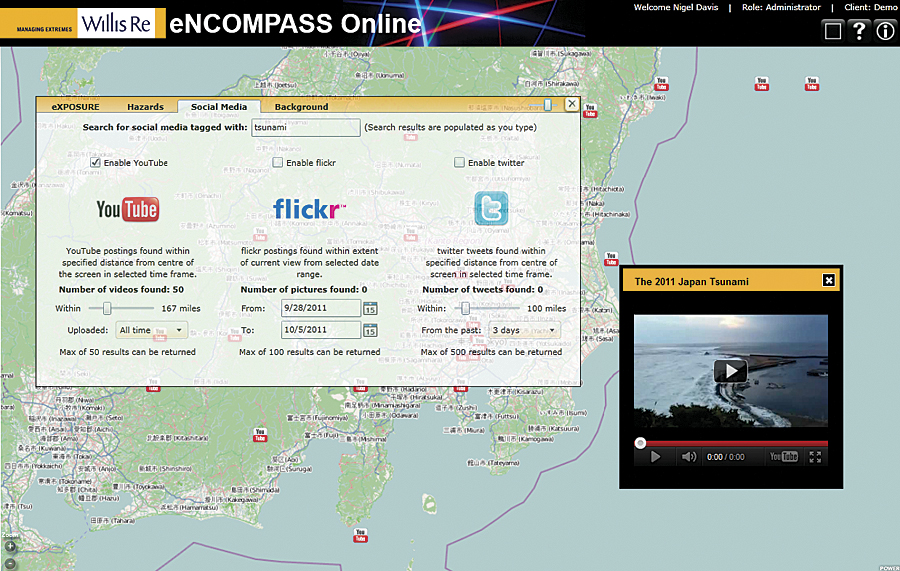
Visualizing social media posts allows insurers to get reports on events as they happen.
One of the powerful analytic functions of the solution is the tsunami impact footprint. Using a mapcentric view of risks in a portfolio makes it much easier to identify insurance risks impacted by the tsunami. Using ArcGIS, risks in the tsunami zone can be easily identified, extracted, and exported for offline loss estimation.
Finding the correct location of policyholders was more difficult. Often, insurance companies hold policy data aggregated in various levels, such as administrative boundaries. Instead of providing point data for each policy at the street address level, many insurers only hold policy location information by postal codes, counties, or municipalities. This is often true in Japan, as well as many other countries. Poor addresses are the result of incomplete data capture, poor addressing systems for a particular country, or perhaps high purchase costs for geocoding to high resolution in a particular country. While many insurers believe that the cost of creating the geocodes surpasses the benefit of doing so, not providing accurate address-level information means that there is not much to work with when estimating damage. Willis Re worked with clients in Japan to find the most accurate location information it could. Coupled with data on flood inundation, Willis Re was able to begin providing the services required to assist people in rebuilding their homes and businesses. Next time, hopefully, the process will be easier.
After the various catastrophes this year, Willis Re observed an increase in the appetite for better address data to use in tools, such as eNCOMPASS Online, to facilitate decision making. Insurers have begun capturing policy data, including the address, not just a postal or ZIP Code, and passing this up to the broker. Nigel Davis, executive director of product development at Willis Re, says, "Unfortunately, a disaster tends to emphasize the importance of having better data."
Remote Sensing Versus Near Sensing
Another aspect assisting in collection of more accurate data is a phenomenon called volunteered geographic information. "Suddenly, we have all these people on the ground who are connected by virtue of their personal devices: laptops, smartphones, digital assistants—you name it," says Davis. "Instead of remotely sensed data, we are getting 'near-sensed' data from people who are using social media to report on events as they happen via text messages or photos they take on the ground."
If these on-the-scene reports contain a location—and many do—this information can be harnessed. Location-aware social networks have a huge potential to enable people in a community to help themselves during a crisis. Spatial analysis makes crowdsourced data actionable. While one Flickr, Twitter, or Facebook post may not be critical, if there are many posts, a heat map from data collected on the ground pertaining to property damage, hazards, evacuations, power outages, and help and services can be collected from the best source of data—those affected. Visualizing this data as hot spots or trends gives an idea of the density of reports coming from a single area. This can assist in allocating resources to those who need the help most or aid the validation of whether incidents reported are corroborated by others, adding increased clarity to a situation. More than just dots on maps, hot spots organize lots of data and quickly provide a better understanding of the data. Reports can also be filtered by date to see daily trends. Providing this information in a spatial context can connect individuals and optimize the use of trained resources.
"GIS can help brokers find all the Flickr posts within 100 meters of an insured property, for example, to get real understanding of damage and claims from those actually in the area," says Davis.
From Crowd to Cloud
The Internet is a natural platform for geospatial analysis. Many participants can easily move from data sharing to creating shared services in this environment. The technology makes it possible: collaborative computing, service integration, mashups, user-contributed content, and distributed data management are some of the many ways that access has been opened to many new users and applications. While the technology opens the gates, it takes more than technology to create applications that are useful. Access to authoritative data and committing the platform resources allow communities to use the technology in the manner they need to accomplish their tasks.
For more information, contact Nigel Davis, executive director, Team Leader Platforms and Delivery, Global Analytics, Willis Re (e-mail: davisn@willis.com), or visit www.willisre.com/Risk_Quantification/Risk_Management/Analytics. To learn more about how GIS helps insurers, visit esri.com/insurance.
Related Podcast
Helping Insurance Companies Understand Where Risks Are
Nigel Davis discusses eNCOMPASS, a cloud-based risk analysis solution based on ArcGIS.
Listen to the podcast. [17:00 | 16 MB]