Opening Up Health Reform
Riverside County's Public Health Department Takes a New Look at Grant Applications
Highlights
- County staff can now easily create drive times with GIS for several clinics.
- Up-to-date information, including Census 2010, is readily available for analysis.
- Community Analyst integrates well with the existing ArcGIS installation.
Staff at the Epidemiology and Program Evaluation Branch of the Riverside County Department of Public Health understand the power of a map. This branch performs most of the data profiling for anyone who needs map-level data at the Department of Public Health. The maps are used to promote and protect the health of county residents and visitors, as well as ensure that services promoting the well-being of the community are available. From grant work for funding health programs to ensuring that people across the county have fair and equitable access to emergency medical services, maps provide insight like no other tool.

Riverside County is using Community Analyst to apply for grants for low-income community clinics, analyzing how long it takes for members of these communities to travel to the clinics.
Riverside County Department of Public Health oversees the health of almost two million people located in more than two dozen cities. Issues the department faces in this culturally diverse population include high rates of cardiovascular disease, obesity, and physical inactivity.
"It is our vision," explains Wendy Betancourt, public health program chief of Epidemiology and Program Evaluation at the Riverside County Department of Public Health, "that the county's residents will engage in active, healthy lifestyles; enjoy good physical and mental health; and have access to appropriate and cost-effective preventive, primary, specialty, and emergency care. This can be achieved through a high level of public and environmental health services and mental health programs where these services are most needed."
To target these areas and manage a finite arsenal of resources and government funds, the Riverside County Department of Public Health turned to GIS to help make decisions. The department has been a user of ArcGIS for Server and ArcGIS for Desktop for a number of years. It uses ArcGIS to easily share data back and forth between other Riverside County departments and the federal government, whose staff are also standardized on the software.
Easy Drive-Time Analysis for Health Reform Law
Staff at the Epidemiology and Program Evaluation Branch found out about a new Esri software solution—Community Analyst—through a list service and decided to explore its possibilities. Epidemiologist Kevin Meconis and research specialist Wayne Harris have put the web-based mapping and reporting solution to work analyzing data. They are specifically using the solution to help the county adhere to a new health care reform law that requires the county to ensure that its clinic system serves low-income community members and the uninsured. The federal health reform act includes $11 billion for nationwide expansion of community clinics like these, and California is gearing up to receive $1 billion of that money. Riverside is looking forward to securing some of this funding for its community clinics. The law takes effect in 2014, but Meconis and Harris are using Community Analyst to research a preparatory grant application that in essence gives them a head start to this process.
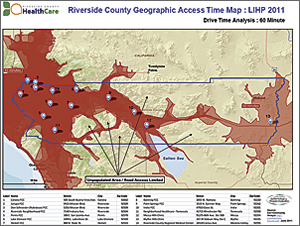
The grant application requires a map product displaying a 60-minute drive time of the catchment area surrounding each clinic; Meconis was able to easily mark on the map the exact locations of the clinics based on the clinic addresses and then calculate drive times for each clinic. "There was no other way to do this that was as convenient," says Meconis. "I don't think we would have been able to perform this function any other way."
And even though this particular feature of the software was new to Meconis, in less than a day, he understood how to use the software and created a customized drive-time analysis on a dynamic map. This analysis was then easily output in the format he needed to submit for the grant.
The Latest Data at Users' Fingertips
The ability to generate profiles was another feature of this GIS solution that the epidemiologists and researchers appreciated. Before using this solution, staff would have to find the area on a map that they were interested in and then ferret out tabular data from multiple sources, such as the American Community Survey (ACS) and the US Federal Department of Finance and Population estimates.

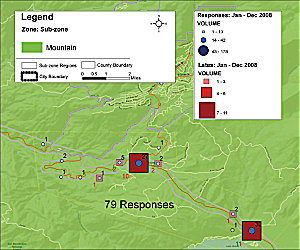
This ArcGIS analysis allowed branch staff to make sure ambulance services were in compliance with county regulations for response times to incidents.
Once the raw data is found, it needs to be put into the proper format to be seen and searched through a mapping interface. That process could be drawn out and cumbersome, and while Meconis says he and his colleagues are pretty good at hunting for data, the time it takes to find it can certainly be used on more valuable efforts. All this information became available to them. From ACS data contained in one-, three-, and five-year databases, as well as data from the Census 2010, Census 2000, and 1990 Census, Esri offers current-year demographic estimates that are included in the licensing of the solution. Geographies not supplied by the Census Bureau are also available through Community Analyst and include ZIP Codes, designated market areas, rings, drive times, and hand-drawn areas. Data for states, counties, tracts, block groups, places, core-based statistical areas, congressional districts, and county subdivisions is also provided.
"One of the requests we always get is to find the latest data that is available," says Meconis. "Before, the most up-to-date data we had to work from was usually several years out of date; now we have the 2010 estimates right at our fingertips."
Branch staff help with several grant applications each year. Sometimes, depending on the nature of the grant, the department must also apply for many certifications for federally qualified health centers. This means they routinely have to provide documentation to their funding sources that they do indeed serve the communities they state they are serving.
Part of this process requires the ability to create custom profiles based on selecting more than one ZIP Code and aggregating the data. Now the staff select the appropriate areas around each of these clinics, as well as parse the included data with their own data. "This is incredibly convenient, because all the data is in one place, and we don't have to look elsewhere for information on race, ethnicity, age structure, economic indicators, and other information," says Meconis.
Managing Workflows for More Efficiency
Community Analyst integrates well into the workflow of the branch staff. They support more than 10 departments in the Riverside County Department of Public Health using ArcGIS in many different capacities.
Currently, branch staff are working on a grant program for healthy homes funding that helps people remediate older houses that might contain dangerous substances, such as mold, insects, or lead paint. GIS is used to find and identify locations for at-risk housing across the county to help target their services. Since this information is all available from the county databases—which are maintained in geodatabases—ArcGIS can be used to easily find and analyze the information, such as identifying older neighborhoods and specific homeowners.
GIS is also helpful for supporting the emergency medical services program. By looking at ambulance service areas on a map, branch staff are able to ensure that the ambulance companies are in compliance with county regulations for response times to incidents. "Anytime there is an issue with a provider about where a call is located and whether it is inside a particular boundary or not, maps are used to resolve the dispute," says Meconis.
The county also works with schools and law enforcement to obtain grants for educational programs promoting safe walking to and from school. Detailed maps show the community where schools with high pedestrian traffic are located, as well as areas that have had past incidents, and help them plan routes that are safer.
For more information, contact Wendy Betancourt, Riverside County Department of Public Health (e-mail: wbetanco@rivcocha.org).