Winter 2009/2010
Winter 2009/2010 |
|||||||
|
|
|||||||
GIS for Customizing Earth Sciences Applications
Zeroing In on Natural Resources |
|||
Highlights
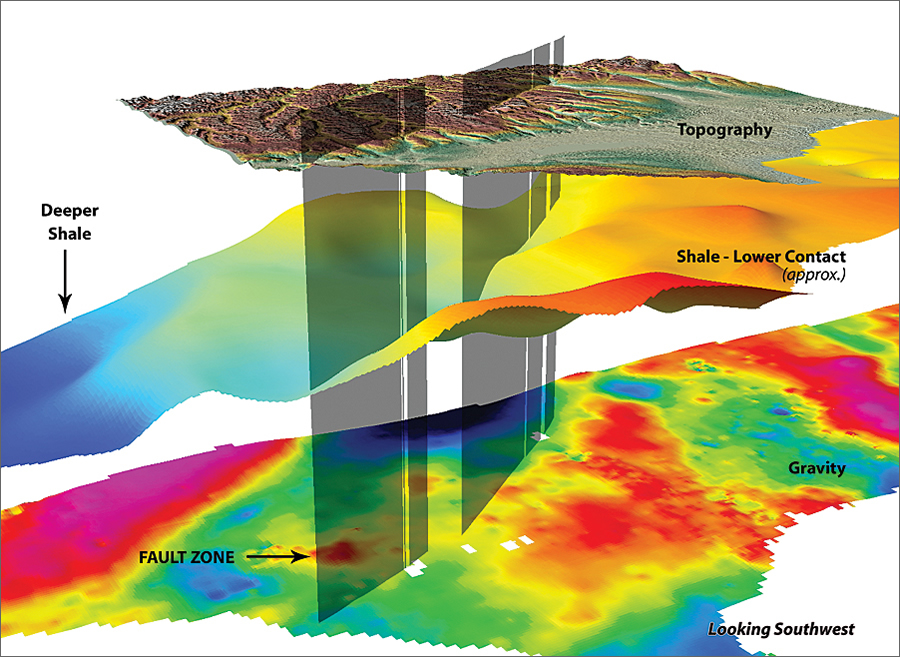
Hydrocarbon exploration is an expensive, high-risk operation that involves searching for hydrocarbon deposits (like oil and gas) beneath the earth's surface. Though visible surface features can provide evidence of hydrocarbon generation, most exploration methods depend on highly sophisticated technology to detect and determine the presence of these deposits deep within the earth.
In early 2000, there was a significant natural gas discovery in southern New York that led to a boom in hydrocarbon exploration. Shortly after this discovery, MIR T�l�d�tection Inc.—a natural resources consulting firm located in Qu�bec, Canada,—began providing expertise to help target hydrocarbon reservoirs. Among the many services MIR provides are customized earth sciences applications that support hydrocarbon exploration in North America through the capture, integration, and analysis of geologic, remotely sensed, and geoscientific data. Its research plays an integral role in successfully turning leads (structures that may contain or trap hydrocarbons) into prospects (leads that have been fully evaluated and are ready to drill). Through the support of the New York State Energy Research and Development Authority (NYSERDA), MIR developed an integrated approach to hydrocarbon exploration for the southern part of New York. The model leverages ArcGIS and the ArcGIS 3D Analyst extension to structurally analyze surface and subsurface data and target promising areas for exploration. This analysis optimizes the planning of costly seismic surveys—a process by which sound waves are used to create a profile of an area's substructure. Once a seismic survey has been completed and a prospect identified, exploration wells are drilled to conclusively determine the presence or absence of oil or gas. MIR built its hydrocarbon exploration model by customizing an in-house process to effectively merge surface and subsurface data. A variety of data sources was incorporated to analyze the earth's surface, including Landsat satellite imagery that offers a multitemporal, multispectral, and multiresolution range of imagery ideal for land-cover analysis. It also incorporated a digital elevation model (DEM) that shows landform arrangements associated with subsurface geologic features. The datasets were orthorectified, mosaicked, and processed through shaded relief techniques to create a detailed representation of the earth's land cover. Airborne magnetic data sources that monitor variations in the earth's magnetic field were then integrated, along with gravimetric data (surface point measurements), to analyze the earth's substructure and identify deep source basement fault geometry (rocks that exist below younger sedimentary rocks). By integrating these data sources, MIR geologists could create subsurface layers and study data from two to four kilometers beneath the earth's surface. Using ArcGIS 3D Analyst, MIR was able to achieve a three-dimensional view of the hydrocarbon exploration model, showing spatial relationships between surface landform patterns and deep subsurface fault zones (which refer to rock fractures), along with their potential control on sediment deposition. ArcGIS was leveraged to represent the data in a series of lineament maps that highlighted fracture patterns on the earth's surface. Geologists used filtering methods to highlight specific features of interest (or leads) that would serve as target areas for detailed seismic surveys. By linking this information to subsurface data, the geologists were able to identify connections between the earth's land cover and fractures deep within the earth's crust that date back more than a billion years. "The extension provided a simple method for viewing surface and subsurface data so that we could easily identify correlations between surface lineament corridors and subsurface geophysical discontinuities," says Michel Rheault, president, MIR. "We were then able to extrapolate the surface geologic interpretation and propose new fault zones that may contribute to reservoir generation or trap hydrocarbons deep within the earth." MIR's structural maps uncovered new patterns in the earth's surface that had never been identified on existing geologic maps. For example, piles of flat-lying rock units were sculpted by rivers, resulting in valleys that had previously been mistaken for surface fractures. According to MIR's research, these fractures likely extend deep down beneath the surface and crosscut porous rocks—information that is critical to hydrocarbon exploration. These new lineament-based structural maps are leveraged to optimize seismic survey planning and increase the success rate of costly drilling activities in New York and the province of Qu�bec. More InformationFor more information, contact Michel Rheault, MIR T�l�d�tection Inc. (e-mail: mrheault@mirteledetection.com; tel.: 450-651-1104, ext. 22; Web: www.mirteledetection.com). |