Philadelphia Uses Robotics and GIS to Map Below Market Street
Lidar Speeds Up Mapping of Bustling Center City
Highlights
- The city needed comprehensive spatial data information to understand its public infrastructure better.
- The mix of GIS, lidar, and robotics produced a view of the infrastructure inside and out.
- Staff took 20 hours to collect all the data, a fraction of the time needed using traditional collection methods.
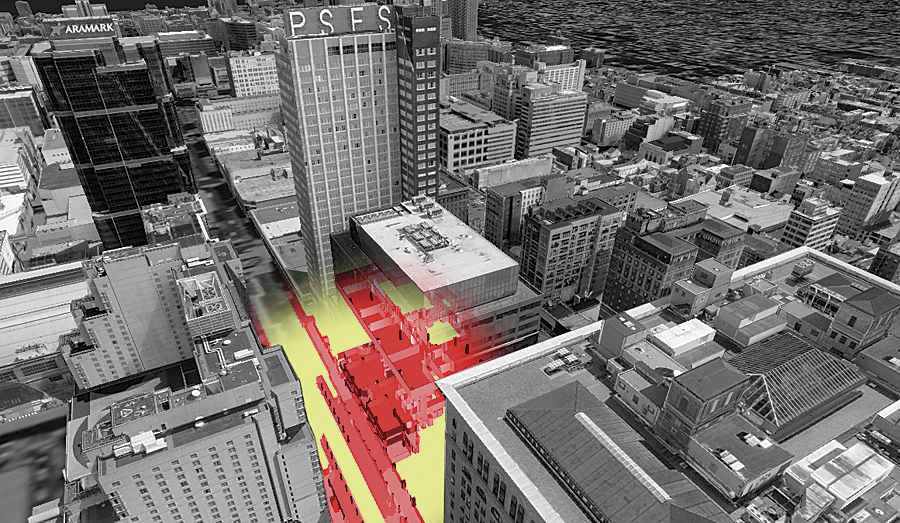
Using robotic lidar technology, Penbay staff created an accurate floor map of the underground infrastructure in Center City, Philadelphia, that connects several buildings along Market Street.
Center City in Philadelphia, Pennsylvania, is a confluence of transportation, shopping, business, and government agency activity, with several multilevel spaces (including underground) within a few blocks. The fifth-biggest city in the nation, Philadelphia also boasts the third-largest downtown population. The City of Philadelphia is committed to encouraging business and real estate development in the area and has embarked on an innovative project to build up the area while at the same time making certain the downtown area remains ready for business every day.
One important aspect of this project was that the city staff understand their building infrastructure better. They were interested in seeing the relationship between pedestrian concourses with platforms, corridors, stair locations, and ramps; ingress and egress points; emergency access and air vent facilities; and connections between levels. To effectively analyze and manage this critical public infrastructure, they needed access to accurate and comprehensive spatial data information. This included data about space, like rooms, and how it is being used; asset data, such as fire extinguishers; and other components found within the rooms. Images needed to be collected to guide anyone who needs to access the space, such as public safety officials, so they can get a real sense of what a space looks like.
PenBay Solutions, an Esri Partner headquartered in Brunswick, Maine, was contracted by the city to provide facility management mapping services for a pilot project aimed at testing the effectiveness of a total 3D GIS solution. This service included interior data collection using an innovative robotic platform employing 3D lidar. The robotic platform collected thousands of data samples as it was guided by a surveyor through the buildings. The data was precisely geolocated to a point on a high-resolution map of the interior space. This allowed staff to develop spatially accurate floor map data of the underground infrastructure that connects several notable buildings along Market Street in Philadelphia.
While the city has been a longtime user of ArcGIS, like most traditional local government GIS installations, its database did not include data for the insides of the Center City buildings or the vast building infrastructure under the streets. To maintain and grow the city effectively, staff needed a complete view of the infrastructure—both inside and out—of buildings, railways, and surrounding areas for their facilities management, public transit, public safety, space planning, and real property departments.

A Trimble TIMMS unit was used to collect data points of every object in the space that was mapped, from walls to doors to desks and chairs.
Understanding from the Inside Out
A site assessment and requirements validation was conducted at the client site to plan for collecting the data necessary to help the city. The goals of this activity were to validate deliverable requirements and define data collection specifications; identify project logistical support requirements; discuss and validate project staging, access, and scheduling dependencies; and visually inspect project areas of interest.
Upon completion of the site, a detailed list of priorities, points of contact, access dependencies, and geographic proximity that allowed the creation of a project plan and schedule to capture the data was created. Center City facilities are complex and have a high volume of pedestrian traffic. Minimizing survey time and disruption was of high importance to the city. The decision was made to operate a two-person crew on-site under the control of a project manager. This plan optimized the use of staff so that there would be a minimal impact on building occupants and client resources.
Open During Construction
Once the dates for the survey visit were determined—the survey itself took place in the fall of 2010—PenBay started the logistics necessary to mobilize the equipment and staff needed to execute the data collection phase of the project. Upon arrival at the site, the survey team closely coordinated its collection activities with the client.
The robot that the surveyors used was pushed through each hall and room at a normal walking pace. Lidar was used by the robot to measure the distance to each object by illuminating the target with light from a pulsating laser. Data points were collected illustrating where every object in the space is located, from walls and doors to desks and chairs. The robot also took spherical images with a camera that takes 360-degree pictures inside the building and then georeferences them. This provided a continuous image of the space that can give a more accurate representation of the real buildings.
Since data collection happened mostly at night to keep with Center City's mission of not impacting the community, security escorts were provided by the city's public transit agency, the Southeastern Pennsylvania Transportation Authority, for safety, as well as to provide unencumbered access to all areas, such as the subway system and secure buildings. In total, the team collected 340,000 square feet of designated infrastructure. The survey provided the city with a clear and accurate view of how its underground infrastructure links to its aboveground buildings and roads. The combination of GIS and robotics provided the ability to measure pertinent space in a fraction of the time it takes with traditional collection methods. Staff took only 20 hours to collect all the data necessary for the pilot project.

The new dataset includes data for the inside of the Center City buildings and the vast infrastructure underneath the streets in the area.
One Cloud—Many Datasets
PenBay provided this data to the city in a building information system data model-compliant dataset that included CAD (AutoCAD) and 3D building information modeling (Revit) files of the area of interest and a primary deliverable of an ArcGIS geodatabase. Using ArcGIS for Server and the geodatabase, city staff have access to the data files easily over the web.
A 3D video dataset was also collected for the entire captured area. This is of particular interest to public transit and the public safety community for planning and preparedness workflows, which provide assistance to facilities managers in condition assessment and asset inventory.
Through this pilot, the city learned how reliably critical deliverables can be created to support its facilities management initiative using GIS and lidar. Discrete spaces were defined accurately on maps, including where boundaries, such as hallways and rooms, begin and end; floor plan data was captured to represent interior space and structure accurately; and facility surveys can be performed quickly, safely, and cost-effectively.
For more information, contact James Querry, GIS director, City of Philadelphia (e-mail: james.querry@phila.gov), or Stu Rich, PenBay Solutions (e-mail: SRich@penbaysolutions.com).
Related Podcast
More Accurate Mapping with 3D Photogrammetry and Lidar Data
Aldo Facchin of GeoSoft explains why the integration of two types of remotely sensed data can help create more accurate maps. Listen to the podcast. [8:00 | 8 MB]