Esri Introduces Landsat Data for the World
Free Multitemporal, Multispectral Global Image Services
Highlights
- Access to online dynamic Landsat image services
- Easy-to-use interactive tours, web maps, and a lightweight web application
- Image change analysis spanning 30 years
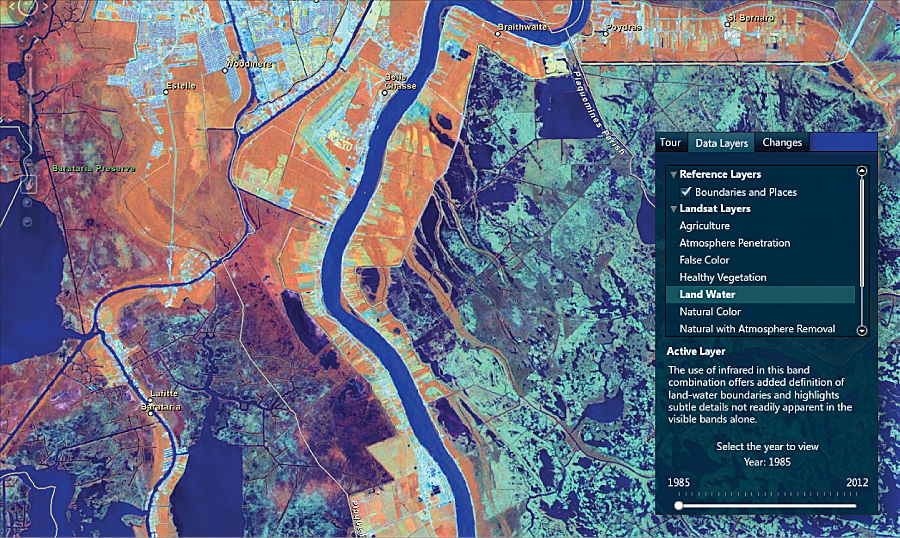
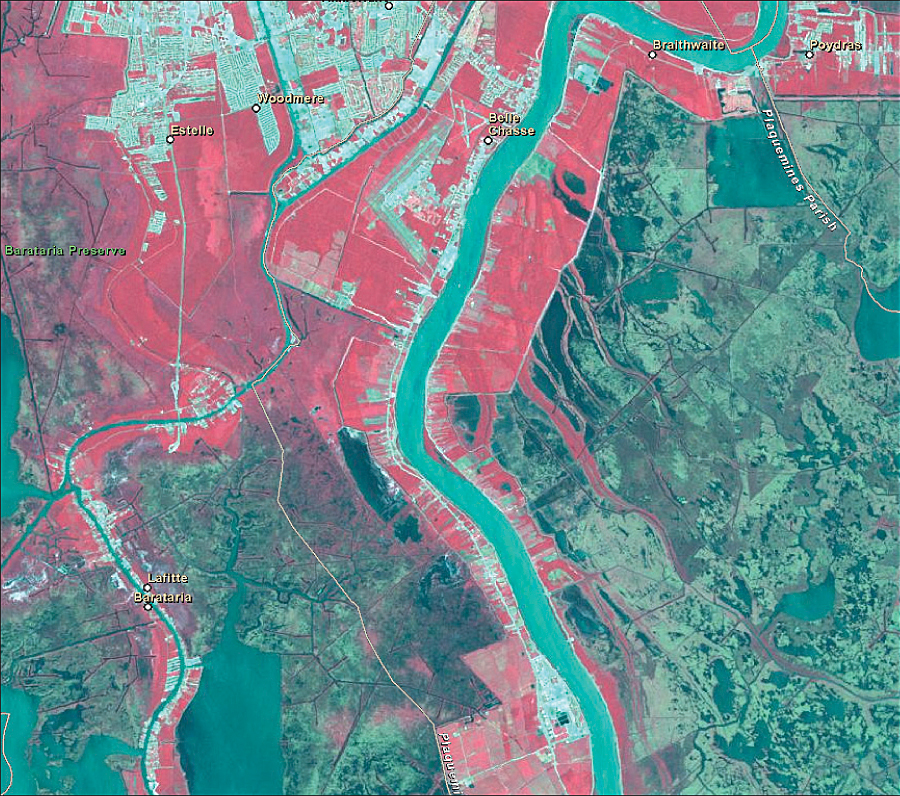
Images above and below: The Landsat viewer provides access to the GLS datasets, which include some of the best worldwide imagery available, span multiple decades starting from 1975, and are multispectral (courtesy of the US Geological Survey).
In 2008, the secretary of the US Department of the Interior (DOI), Dirk Kempthorne, addressed the audience at the Esri International User Conference and announced that as part of a larger US government initiative to make its data more available, all Landsat scenes in its archives would be available for free. This includes the Landsat Global Land Survey (GLS) datasets, which provide the best worldwide imagery data for how our earth is changing. Last year, Esri announced that it would make this imagery data accessible for free on ArcGIS Online.
Working in close collaboration with DOI, Esri is pleased to announce the release of the Landsat imagery services. These image services enable fast and easy access to 30 years of Landsat imagery as part of ArcGIS Online. Esri is providing this data (more than 8 TB) on ArcGIS Online and serving it as over 20 different dynamic, multispectral, multitemporal image services that provide access to the full image information content, along with change detection capabilities. In addition, Esri has created web maps and an interactive web application that leverage these image services, providing even greater access.
The image services being provided on ArcGIS Online are not just "pretty pictures." They provide dynamic access to all the spectral and temporal information in this massive collection of imagery. These dynamic image services represent on-the-fly processing of the original Landsat scenes that contain all the multispectral, multi-temporal information available in the imagery. This enables all the data contained within the imagery to be immediately available for use in maps to provide greater understanding and analysis. Users can define what processing is to be performed on the imagery, and the server performs this directly on the source images, returning the information required for the area of interest. The services are available in different standard band combinations. These band combinations include false color (bands 4,3,2)—useful for vegetation studies and crop growth monitoring, natural color with atmospheric penetration (bands 7,4,2)—best suited for analysis of urban studies, and vegetation analysis (bands 5,4,3)—providing the most information for agriculture and forest management. Since these services are also multitemporal, users can turn back the clock and easily analyze how things have changed in their region over the past 30 years.
These image services are available as standard services through ArcGIS Online. Users will be able to build web maps utilizing this information and share their analysis for better understanding and collaboration. Esri has also provided a series of web maps in ArcGIS Online that highlight the usage of these new services and help explain the measurement of change over time and space using the Landsat data. For example, users interested in looking at the change in coastal landforms could access and use the Land Water service in ArcGIS Desktop or ArcGIS Online applications, then use the temporal slider or service properties to define the epoch of greatest interest. Directly using these image services removes the requirement for users to store, manage, or process these large datasets themselves; instead, they can directly use these services as if all the different image products were stored locally.
In addition to providing access to the image services, Esri has created an easy-to-use web-based Landsat viewer for visualizing, analyzing, and detecting change using these image services. This viewer accesses the Landsat dataset as image services. Informative screens make it simple for everyone to understand what they are looking at and how to navigate through the information. The interface enables one-click access to a wide range of various information products with the ability to quickly zoom and pan to anywhere in the world and visualize similar information and trends. Behind the scenes, ArcGIS Server performs all the required processing on the fly. ArcGIS API for Flex was used to build the application.

The Landsat viewer contains fast, easy-to-use change detection tools. Where change occurs, it is easy to visualize the differences by looking at them spectrally over different time periods. The change detection tools enable users to conduct multitemporal image analysis for change through image differencing. The Landsat viewer automatically calculates this information based on the user's selections and displays the resultant information on a change detection map. Users can quickly understand the change that has taken place by visualizing and interacting with it on the change detection map.
People worldwide are trying to solve complex environmental challenges, and access to Landsat datasets through ArcGIS Online can make a difference.
For more information, visit esri.com/landsat.
See also "Using Landsat Image Services."