Fall 2008
Fall 2008 |
|||||||
|
|
|||||||
Tallahassee-Leon County GIS Rolls Out First Phase of Incident Management System
Enterprise GIS for Disaster Management |
|||||
Highlights
The world of 21st-century disaster management is dynamic, complex, and wide ranging. Every year in the United States, large-scale wildfires, hurricanes, floods, or other natural disasters impact the lives of millions. In addition, the threat of terrorist attacks and other man-made phenomena makes providing safety, security, and rapid emergency response an even greater challenge.
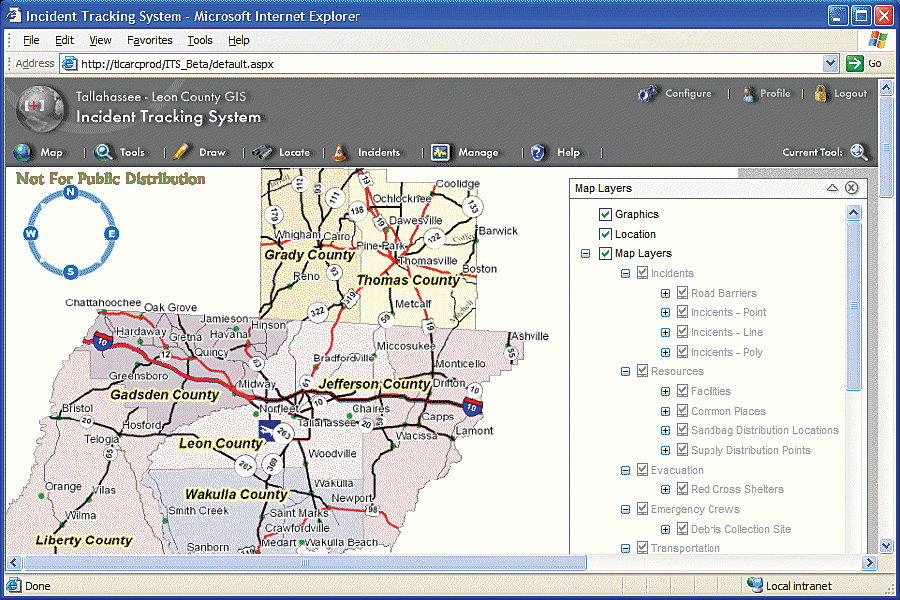
Tallahassee-Leon County (TLC) GIS, a partnership between the City of Tallahassee, Leon County, and the Leon County Property Appraiser's Office in Florida, and the jurisdictions it represents are no strangers to these types of threats. With Florida experiencing its share of hurricanes, fires, and floods in recent years, local government agencies know what it takes to provide proficient emergency response. TLC GIS recently transitioned to a new level of optimized service by building a server GIS-based incident management system known as the Emergency Operations Center (EOC) Incident Mapper. Released in pilot phase as part of a phased rollout, the system complements existing communication networks in organizing, analyzing, and displaying GIS data in an easy-to-understand "big picture" format. It supplies electronic display of disaster activities in real time and supports all phases of the disaster management cycle: preparation, mitigation, response, and recovery. "GIS technology has allowed us the opportunity to do things we have always wanted to do with the resources that we currently possess," says Lee N. Hartsfield, Tallahassee-Leon County GIS coordinator, Leon County, Florida. "We see it as a visual aid for Emergency Operations Center staff during a large-scale emergency or disaster. We tested the system in numerous exercises, allowing us to refine the input and outputs. The system will be used for all types of hazards, including tornadoes, floods, terrorist attacks, law enforcement operations, and quarantines." A Turning-Point MeetingIn May 2005, the Leon County Emergency Management Department called a meeting of all participants of the EOC to provide an update of recent technology advancements. TLC GIS, Red Cross, and the Tallahassee City Stormwater Department demonstrated their various technology efforts, including the use of GIS. TLC GIS provided a demonstration that showcased interactive mapping for monitoring an incident when it occurs and using GIS capabilities for response. As part of the demonstration process, the TLC GIS coordinator invited the group to comment on the application. As discussions continued and more ideas were articulated, an initial outline was drafted that would eventually become the EOC Incident Mapper. The outline focused on building a comprehensive, enterprise incident mapping system to provide an electronic display of disaster activities in real time to multiple users, locations, and agencies. A project workgroup was created that included users and technical support to identify and implement improvements to the outlined system. During the summer of 2007, TLC GIS staff were deployed at both city and county operation centers to coordinate information generation, integration, and sharing using the EOC Incident Mapper. The workgroup continues to meet to review and evaluate the application. The system was deployed in summer 2008 during Tropical Storm Fay with excellent results. "In the past, data related to an emergency was supplied on a case-by-case basis through paper maps," explains Hartsfield. "The paper maps used much of the same basic information with one or two additional attributes added each time. Understanding the wide range of datasets managed by the TLC GIS group, and with the advancements made available by ArcGIS Server, these snapshots could now become something like a live movie feed of the event and related actions. The advantage is that each action is captured, date stamped, and placed into a database. Therefore, data can also be replayed for postevent evaluation. It allows for readily disseminating information; allocating personnel, equipment, and resources; and performing routing based on real-time data and events." As part of the system development, an extensive survey of dedicated emergency and public safety staff was conducted to properly document job processes, particularly during a large emergency. In addition, public safety staff included TLC GIS personnel in its ongoing emergency training and exercises. The incident mapping system is still in the final phases of development, which includes end-user evaluation and testing. In addition, the TLC GIS staff is working to complete a system user guide. An Enterprise Incident Management SystemThe EOC Incident Mapper was built using ArcGIS Server, ArcGIS Network Analyst, and ArcSDE technology. In addition, the project team developed a viewer in ArcIMS for staff to view nonsensitive information during an event.
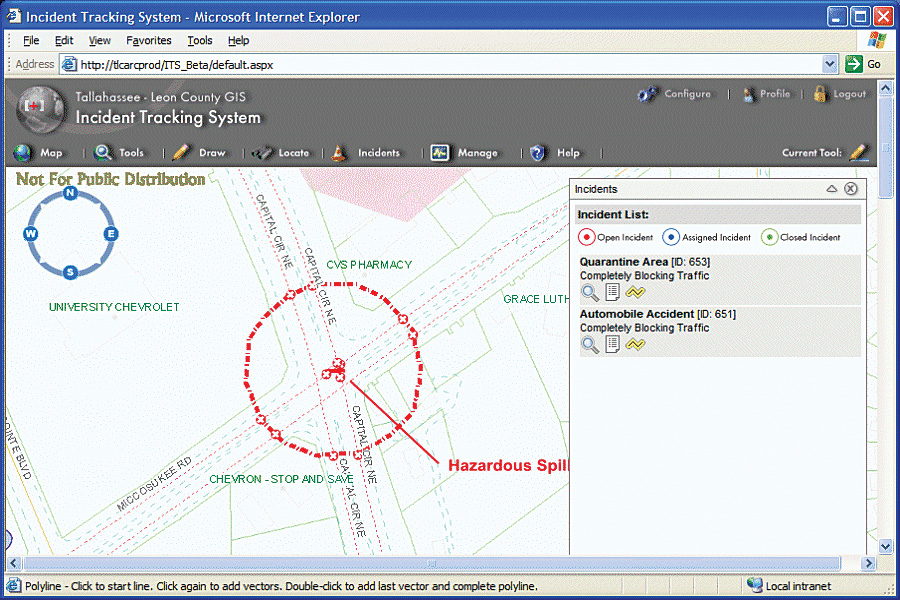
The system organizes data and events into three basic categories: emergency service points, point events, and area events. It allows real-time interaction for managing resource and personnel allocation, placement, and routing. Emergency service points include facilities and apparatus that may be open, closed, or placed on standby. This includes items such as Red Cross shelters, sandbag distribution points, and work crew feeding sites. Previously, these were tracked separately by different agencies. Point events are incidents, such as a fire or a hazardous chemical spill, confined to a specific location. The Federal Emergency Management Agency's (FEMA) National Incident Management System (NIMS) provides a common language and symbology for communicating across organizations for these types of disasters. NIMS training has been ongoing throughout Leon County, which uses NIMS mapping symbology to operate in a coordinated fashion. Typically, disaster and emergency recovery was coordinated mostly on-site, with information being communicated to the EOC when time permitted during the event. Maps were requested from TLC GIS with a runner taking the request to the site and returning with the generated map. The incident management system provides NIMS-compliant symbology for the command center, staging areas, incident basecamps, helibase, and heliport. Using aerial photography, either through the Incident Mapper at the EOC or with a mobile application on a laptop, staff can quickly determine the optimal location for each of these facilities. Their locations can then be communicated to everyone involved over the Internet or over a secured intranet site. An area event includes both man-made emergencies and natural disasters that impact more than one location or a series of locations within the county. The system can quickly adapt from a point event to an area event as the geographic impacts broaden in scope and effect. Users can track several common incidents that may occur simultaneously. This includes automobile accidents, downed trees or power lines, power outages, flooding, and quarantined areas. The common incidents also carry a status indicating open, assigned, or closed, and Incident Mapper can identify whether traffic flow is blocked or impeded. Users can quickly input data and provide updates to an ArcSDE database that allows others to view the information in real time. For example, when an emergency happens, GIS staff can map the above incidents and other data as it comes into the Emergency Operations Center. Users, whether in the EOC or in the field, can see where Red Cross shelters are being set up, the location of debris collection sites, supply distribution points, and more. Users can also generate point-to-point routing with turn-by-turn directions. In addition, they can perform queries by address, intersection, tax-code identification, or other geographic indicator. Users can search for a local business, a government agency, and educational and social institutions by name, address, phone number, and classification. Mapped data can then either be printed or e-mailed. The system, once in full deployment, will be available to any agency within Leon County and the City of Tallahassee. It will maintain 45 spatial data layers, including roads, parcels, hospitals, airports, and multifamily complexes, with a hyperlink to building and site layouts. It will also include a population density grid, areas of potential flooding, hazardous materials sites, evacuation routes, locations of at-risk individuals (individuals who may require special assistance during an evacuation due to a medical condition), traffic light status, aerial imagery, and critical facilities. The system replaces previous department-wide GIS processes and access, opening up data to multiple agencies when an emergency happens. Information is much more readily accessible for gaining an accurate assessment of what's happening in real time and providing the same accurate, comprehensive data to anyone who needs it. More InformationFor more information, contact Lee N. Hartsfield, Tallahassee-Leon County GIS coordinator (e-mail: hartsfieldl@leoncountyfl.gov). |