Fall 2005
Fall 2005 |
|||||||
|
|
|||||||
GIS Reveals the Ups and Downs of the Boston Marathon |
|||||
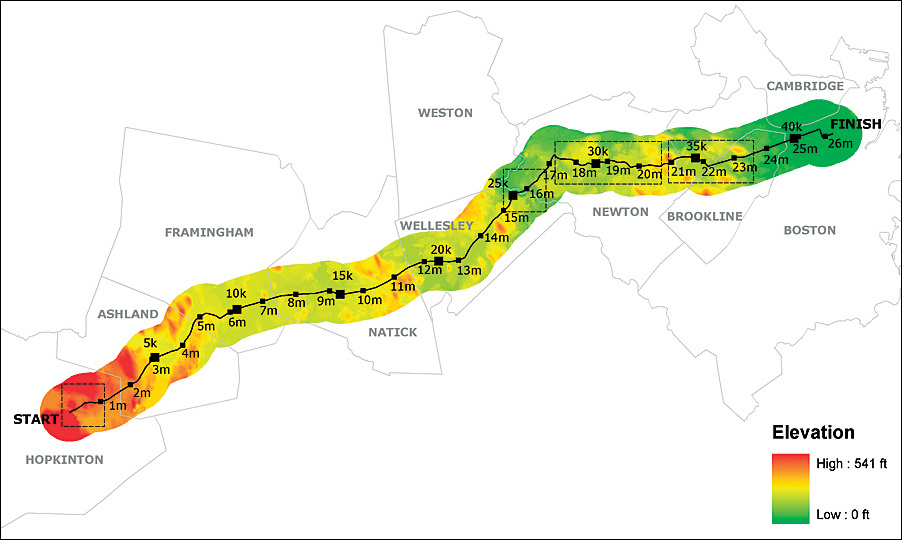
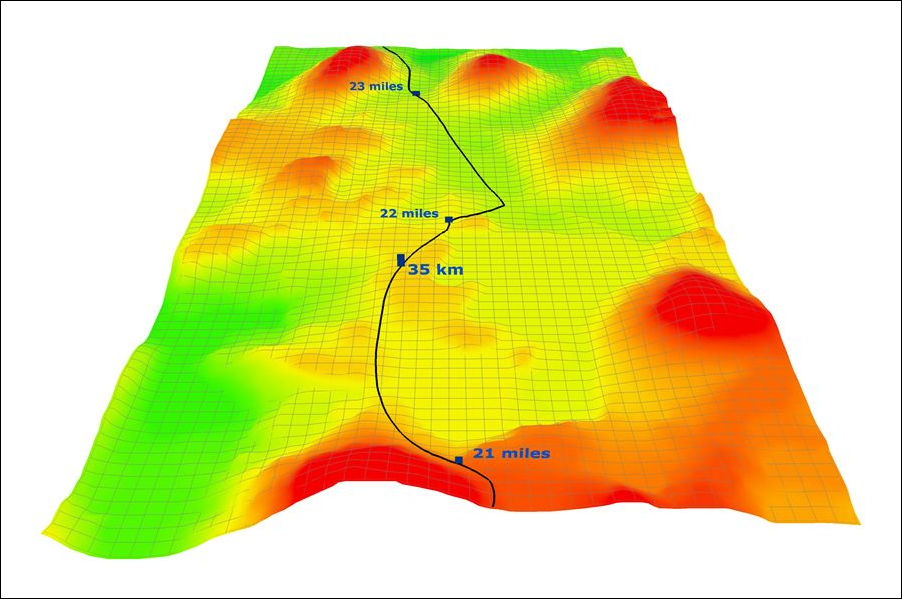
The Boston Marathon is legendary. Not only has it been in existence for 109 years, its participants must qualify to enter the 26.2 mile race from Hopkinton to Boston, Massachusetts. The race takes place each April on the state's Patriot's Day. Spectators line the course and cheer runners through famed features such as "Heartbreak Hill," which is actually the last in a group of four hills known as the Newton Hills between mile 17.5 and mile 21. By itself, Heartbreak Hill might merely be challenging, for it is not the steepest grade on the course; however, runners reach it at mile 20.5, which makes it the toughest stretch in the race. The moniker might also give the impression that the overall route is hilly, but in actuality, approximately 61 percent of the course is flat. Such details, including the elevation, average grade, and steepest grade for course segments, were described and illustrated in a feature article in the 2005 official race program. Accompanying the article were profile maps created in ArcGIS Desktop.
Ray Carnes, Esri, produced the maps that visualize the route in a 3D context. Elevation contour data from MassGIS (www.mass.gov/mgis) was combined with data that comes with ArcGIS. After some simple geoprocessing and annotation work, Carnes created a line segment that showed points for both mile marker and kilometer distances. ArcGIS 3D Analyst was used to visualize the topographic detail for each section. Text descriptions and elevation color ramps were added to note the highest and lowest elevation in each section, as well as the average grade and steepest grade that runners would experience. A grid pattern on the 3D surface data added visual interest. "The idea was to give runners something more than just a 2D view of elevation," says Carnes. "The 3D maps give a much better perspective of the terrain found along the course." The article mentions that the maps reveal interesting truths about the famous course, "displaying the largest hills in all their glory, while also detailing the many smaller contours that make the Boston Marathon so unique." For approximately two decades, a faulty course profile showed the elevation at the race start in Hopkinton to be about even with the top of Heartbreak Hill in Newton. Today course elevation is much better understood. The highest point in the marathon (463 feet/141 meters) is at the start line in Hopkinton, where the runners begin their downhill dash on their journey to Boston. When they reach the first mile marker, the steepest hill is already behind them. For more information, contact Ray Carnes, Esri (e-mail: rcarnes@esri.com). |