There’s a Starbucks at Fifth Avenue and F Street in San Diego, California. On a cloudy July morning, a long line of people heading toward the Esri User Conference queued up inside. They wanted coffee and confections, fuel for a day of watching geospatial technology demonstrations by Starbucks and other organizations.
This scene was being repeated simultaneously at 10 nearby Starbucks locations, including two inside the San Diego Convention Center, where the conference was being held. While that may seem like a bit of store overcaffeination, Starbucks knows its customers (including many among the 16,000 people at the conference). All those stores exist thanks to a geographic information system (GIS) application called Atlas, which the company demonstrated at the conference’s Plenary Session.
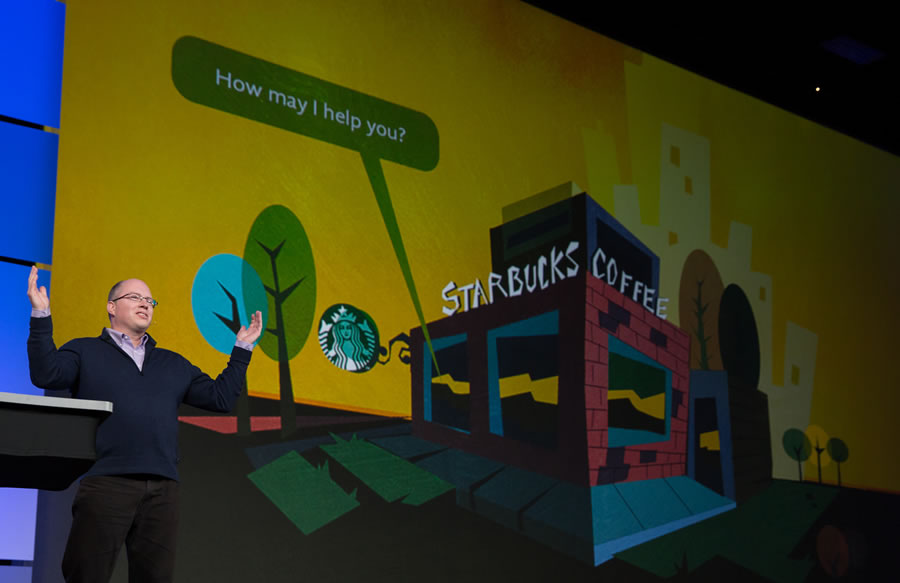
The Starbucks team of Patrick O’Hagan, Zackary Christoff, and Laurence Norton talked about the important role GIS plays within their company including in site selection and product placement. They were followed on stage that day by guests such as US secretary of commerce Penny Pritzker, National Oceanographic and Atmospheric Administration (NOAA) administrator Dr. Kathryn Sullivan, Dr. Bruce Aylward from the World Health Organization (WHO), and Dr. Vincent Seaman from the Bill & Melinda Gates Foundation.
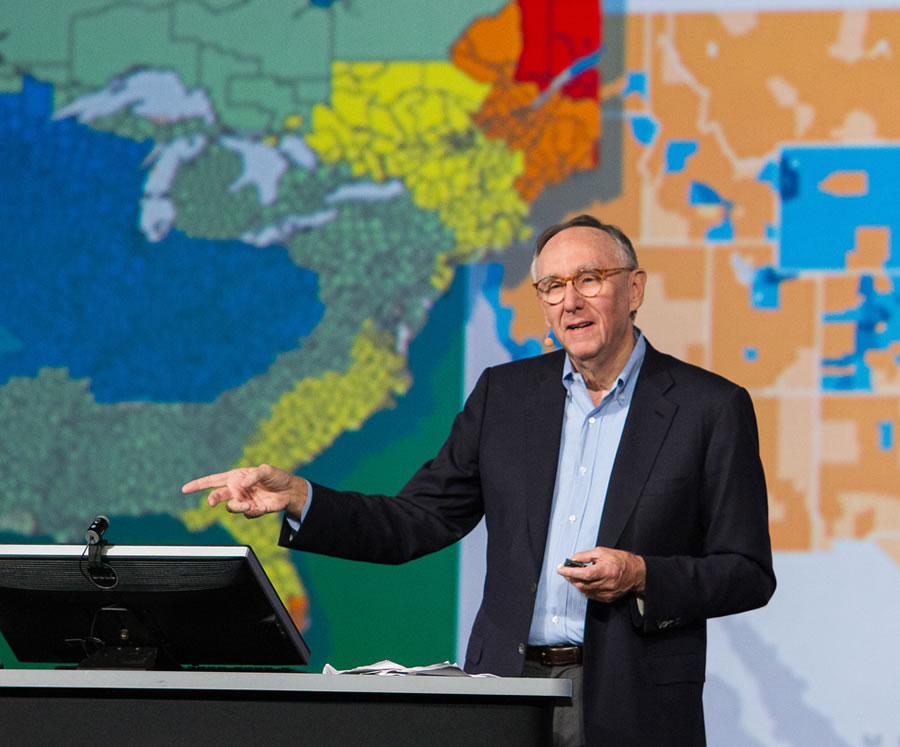
“GIS is integrating geography into virtually everything we do. GIS is changing the way we see things in our organizations and also at the planetary level. And it’s also changing how we act,” said Esri president Jack Dangermond, opening the conference and highlighting the event’s theme, GIS: Creating Our Future.

It’s definitely changing how companies like Starbucks do business.
Growing a Coffee Company
How Starbucks decides where to open a new store in the world depends on analysis done in Atlas, the company’s market planning and store development application powered by GIS.
“Atlas has been and continues to be an incredible success story for us,” said Norton, director of business intelligence strategy and solutions at Starbucks, whose group provides business intelligence to internal business customers. “It’s a large GIS application that includes workflow, analysis, and store performance.”
One of its major uses is to pinpoint the best location for the next store Starbucks plans to open.
“We started big with GIS, tackling one of our business customers’ most critical challenges: How do we continue to grow responsibly as a company?” Norton said.

O’Hagan, Starbucks’ strategy manager for portfolio strategy and market planning, provided an example of how Atlas works. He demonstrated how Starbucks partner Penny Chen in Nanning, Guangxi, China, uses Atlas to help select the right store locations. She can see on a map the local trade areas, retail clusters, demographics, traffic and transportation nodes, and locations where new offices are being built, according to O’Hagan. (Office buildings often translate into customers.)
“For instance, in this part of Nanning, three new office towers will be completed over the next two months,” he said. “After adding a new target area, [Chen] is provided a workflow window [in Atlas], which helps her progress the [new store site] through approval; permitting; construction; and eventually, opening.”
Starbucks also uses GIS to analyze where its customers spend more money than average on coffee purchases as a way to decide where to install the high-end Clover Brewing System. Clover machines brew one cup of coffee at a time at a precise temperature and length of time. “The result is the best cup of coffee you will ever taste—hot, aromatic, and incredibly flavorful,” Norton said. See the video of the Starbucks presentation.

MapIT in Minneapolis
While a lot of people need their coffee, others want their free Wi-Fi. One of the maps at the MapIT Minneapolissite offered by the city of Minneapolis, Minnesota, shows places where people can find free Wi-Fi.
While GIS has been used by the city government for many years, Steve Misterek, the city’s current GIS coordinator, and his team widened the group of GIS users by launching MapIT Minneapolis, an enterprise mapping platform that city employees can use. The platform was created using an Esri ArcGIS Online organizational account. As it says on the website, “Answering the ‘where’ question for any project initiative or important decision is now easy for everyone!”
For example, employee Brendon Slotterback used the Finder template in the ArcGIS Online application gallery to configure an app that Minneapolis residents can use to find out if their house or another building would make a good candidate for solar panels.
In another instance, ArcGIS Online was used to create an app called Minneapolis Park Trees Near You! You can view the map of a Minneapolis park; click on a tree in the park; and find its name, diameter, and monetary value including its contributions in property value and air quality.
However, when 1,800 park trees toppled during a recent windstorm, the city’s Sustainable Forestry coordinator Philip Potyondy turned to ArcGIS. “Already familiar with the Collector for ArcGIS [app] for managing his forest, [Potyondy] and fellow arborists were able to quickly get out into the field to begin collecting the information they needed on the downed trees, using their mobile devices,” Misterek said. The app made it easy for them to efficiently gather the information they needed about the stumps, such as their diameter and the extraction method. The information was used to request bids from contractors to remove the stumps and apply for Federal Emergency Management Agency (FEMA) reimbursements, he said.
Watch a video of Misterek’s presentation.

GIS on a Grand Scale
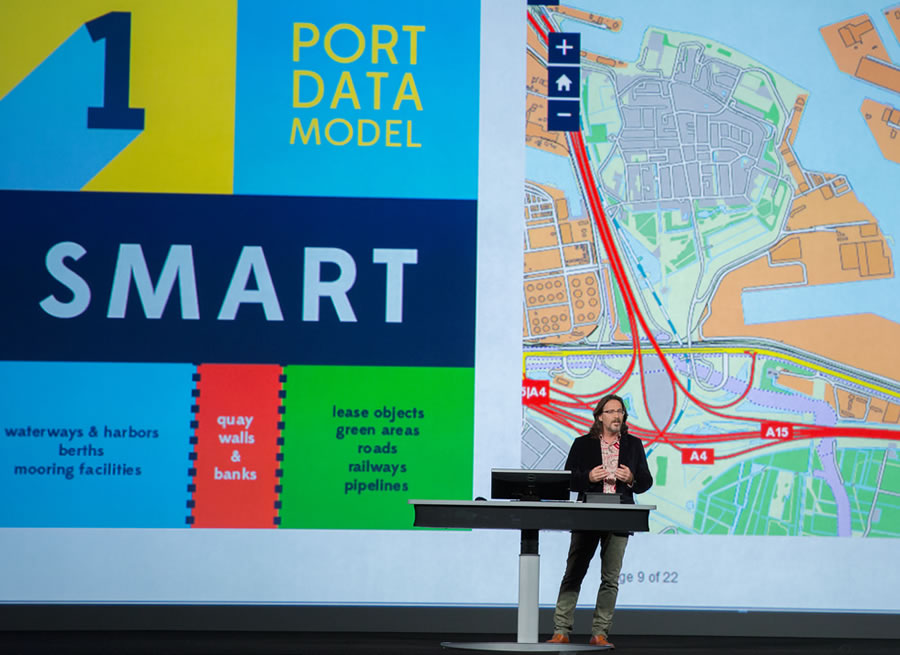
While Potyondy uses GIS to manage trees, Erwin Rademaker uses GIS to manage shipping and other aspects of what goes on at the Port of Rotterdam in the Netherlands. He told the story of why the port implemented PortMaps, an enterprise GIS powered by Esri ArcGIS. He is the program manager for PortMaps.
Rademaker said the port could no longer expand physically, so a mapping system was needed to better manage information about a wide range of operations and make the port more efficient.
PortMaps integrates dozens of different business systems into a single platform, reducing redundancies in workflows.
“We had to create a platform for these users, enabling them a single point of entry for all their information. We had to create a new world-class port map system,” he said. “Since we’ve gone live [in mid-2013], over 300,000 maps have been generated by it. Imagine that. That’s almost 1,000 maps a day.”
Rademaker said the secret to the success of the project was to make the system simple to use and to focus on three major areas in the port: land, water, and the border in between. “After we did that, it was very simple for us to transform 1,500 layers of information into 10 single core objects,” he said.
PortMaps includes SAP, SharePoint, and ArcGIS. “We used SAP for administrative and financial information,” Rademaker said. “We used SharePoint to store all our documents and technical drawings. And in the center, connecting everything with geographic information, there is ArcGIS.”
Simplicity was paramount, and children of port employees tested it before the launch. “We wanted a system so simple that even a child could use it,” he said. “We wanted a system as easy to operate as an iPhone. And it’s very simple. In three clicks, I will be able to retrieve any information I am looking for—if it is the depth or the information of a berth location or even from a cable or a wharf.”
Eradicating Polio
While critical to managing information at ports such as the one in Rotterdam, GIS is also being used in the fight to eliminate polio.
Dr. Bruce Aylward from the World Health Organization (WHO) and Dr. Vincent Seaman from the Bill & Melinda Gates Foundation, the conference’s keynote speakers, gave the audience a primer in polio and demonstrated how mapping technology helps them locate children in developing countries who need to be vaccinated.
“With this technology . . . people set out to find those children, find those communities, get them on a map, get someone responsible for getting there, and get those kids vaccinated to prevent that disease,” Aylward said. “Over one billion children now in total have been vaccinated multiple times through this initiative.”
Watch the polio eradication presentation.

Data Is King
Obtaining accurate data is very important to the polio eradication effort. Pritzker, the US secretary of commerce, spoke about the importance of data including open data.
Data from the US Department of Commerce’s agencies, such as NOAA, help Americans in many ways, including to warn them about severe weather, such as tornadoes, and to drive the economy by putting data into entrepreneurs’ hands.
As part of extending this commitment to what she called this “open data revolution” commitment, Pritzker announced that the Department of Commerce will hire its first chief data officer.
“Data is a key pillar of our department’s open-for-business agenda,” Pritzker told the audience. “For the first time, we have made it a department-wide, strategic priority to unleash more of our data to strengthen our economic growth; to make our data easier to access, understand, and use; and to maximize the return for businesses, entrepreneurs, government, taxpayers, and communities.
Watch Pritzker’s talk. (Esri also supports open data. Visit ArcGIS Open Data.)
Sullivan, the NOAA administrator and a former NASA astronaut, said that her agency strives to provide authoritative and timely data. Environmental intelligence coupled with GIS tools can “provide us powerful situational awareness, insight, and perspective we could never gain otherwise,” she said.
Hurricane Sandy, said Sullivan, drove home the point that communities and agencies need to do more than just respond and rebuild after a natural disaster. “It reminded us that what we need to focus on is not just being prepared but becoming resilient,” Sullivan said. “As we factor into our rebuilding decisions, we need to not think just about building back to what we were before a story. We need to think about building for what’s coming ahead.”
NOAA’s tools now include a Sea Level Rise Viewer to assist in such planning. Watch Sullivan’s speech.
Flipping over GIS
Developing those types of tools in the future will be left to the youth of today. To drive that point home, Charlie Fitzpatrick from Esri’s education team talked about the company’s role in the Obama administration’s ConnectEd initiative.
As part of that initiative, Esri is making ArcGIS Online organizational accounts freely available to all K–12 schools in the United States.
“With that account, they can have individual student logins,” Fitzpatrick said. “They can analyze and publish data just like you guys are doing. And they can share that content, either just within their own organization or out with the wider world.” (Visit connected.esri.com for more information.)

To illustrate what even young students can do with ArcGIS, Fitzpatrick turned the stage over to Kylie Miller and Rikki Vaughan, two fourth graders, and their teacher, Josh Worthy, from Sonora Elementary School in Springdale, Arkansas.
“We have kids as young as seven using ArcMap [and] ArcGlobe,” Worthy said. “They’re building story maps with ArcGIS Online; and they’re solving big, big problems.”
Rikki demonstrated how ArcGIS was used to map where veterans live in relation to Walmart stores as part of a campaign to place the Camp Alliance brand of coffee in the stores. Camp Alliance is a nonprofit organization that supports the military.
Kylie talked about how she and the other students at her school launched a weather balloon this past April that made it all the way to Scottsville, Kentucky.
“It got caught up in a very active jet stream,” Kylie said. “We used our SPOT GPS receiver to track the balloon and record its longitude, latitude, and altitude.” She showed the audience on a map where the balloon went and then displayed a 3D animation of the balloon’s travels in ArcGlobe.
“Our balloon climbed to nearly 100,000 feet and [traveled] 600 miles during its flight,” said Kylie. “Since we couldn’t drive all the way to Kentucky to retrieve our balloon, we reached out to a school called Scottsville High School. They were able to get our balloon out of a tree and ship it back to us.”
The girls received loud applause and a standing ovation from the crowd, especially after they cartwheeled off the stage. (Watch the video.)
Dangermond joked that Rikki and Kylie may be job hunting. “They [will] have their resumés ready for you later this evening.”

