Approximately 400 billion gallons of water are used in the United States per day. In one year, the average American household uses more than 100,000 gallons both indoors and outdoors.
To protect people from contaminated water, the US Environmental Protection Agency (EPA) regulates toxic discharge and sets standards for water quality. The EPA relies on Esri technologies to help manage water quality and other aspects of the environment.
The EPA uses the Esri ArcGIS platform to disseminate data, tools, and maps to the agency’s 10 regional offices. The platform has been a federal government showcase of an effective and efficient enterprise GIS. EPA developers and contractors have launched widely-used GIS web applications such as Environmental Dataset Gateway, Facility Registry Service, and EnviroMapper.
PenBay Media and Esri partner GISi provide geospatial expertise to the EPA Region 3 office in Philadelphia, Pennsylvania, helping the office to advance its GIS platform. The EPA Region 3 office protects environmental resources and regulates the impact businesses and industries have on water, land, and air in Pennsylvania, Maryland, Delaware, Virginia, West Virginia, and the District of Columbia.

PenBay Media and GISi consultants improve work processes, analysis, and reporting. As part of an onsite support team, the consultants assess the needs of environmental projects from a geospatial perspective and offer technical support for data acquisition, maintenance, and management. In addition, these experts tease apart complex spatial problems and bring clarity to environmental issues at both the program and project levels.
Collaborating with EPA scientists, project managers, permitting specialists, and the agency’s GIS coordinator, PenBay Media and GISi consultants provide technical support that improves project workflows. Using ArcPy, PenBay Media and GISi create Python scripts that automate steps in a library inventory process. This saves the EPA considerable time and resources while the team documents nearly 2,000 datasets in the geospatial library. Three EPA divisions use this data to analyze the environment, relying on the PenBay Media/GISi team for analytical support.
The Water Protection Division (WPD) monitors and tracks contaminants in waterways such as lakes and rivers and calculates the total maximum daily load (TMDL) for these contaminants. WPD also regulates wastewater discharge from industries and municipalities. GIS helps WPD scientists identify severely contaminated watersheds and assess the environmental practices of local businesses such as animal feeding operations and industrial facilities.
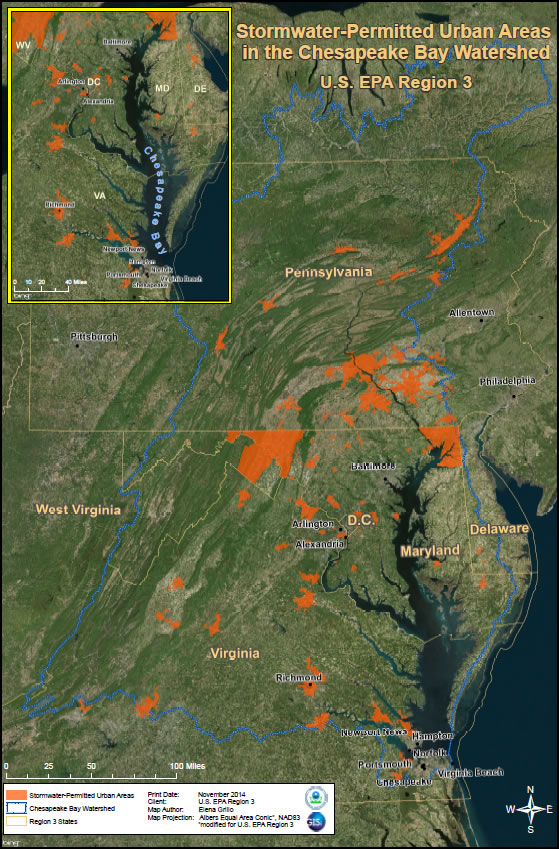
Storm water permit managers and GIS specialists team up to define appropriate data structures and attribution requirements for land-use permit data. Using GIS, they can analyze where the population will increase and determine the areas where additional permits will be needed (Figure 1).
Site inspectors use cameras to document the pollution-control measures that facilities use. Following an inspection, metadata and geotags are assigned to the photos. KML files are used to document the history of an inspector’s route and the photo locations. GIS processes this information and creates reports that can serve as evidence in legal investigations.

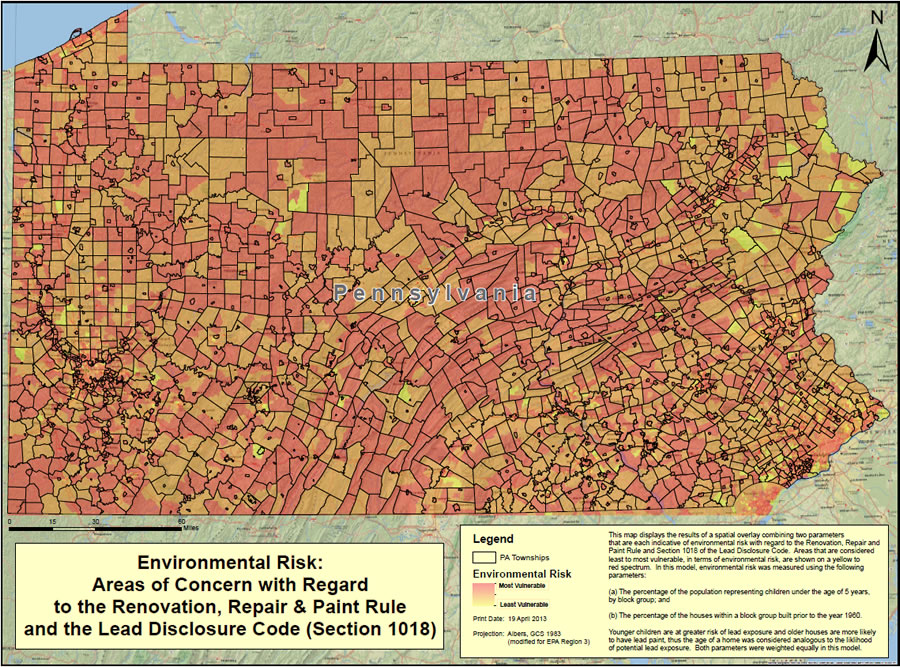
The Land and Chemicals Division (LCD) tracks the storage, use, and release of hazardous chemicals. The GIS team created a GIS model showing the potential lead exposure and environmental risk for young children across Region 3. This information helps EPA inspectors mitigate risk from lead exposure (Figure 2). The division also maps the locations and activity of its programs within the Chesapeake Bay watershed. This information helps managers better assess a program’s progress and identify gaps.
The Hazardous Site Cleanup Division (HSCD) manages the cleanup of abandoned hazardous waste sites listed on the EPA National Priority List, also known as Superfund sites. The location and status of clean-up for each site are displayed on a map, which is shown to US Congress members to apprise them of cleanup efforts in their districts.
The services provided by PenBay Media and GISi continue to help EPA scientists make better, more educated decisions by using the ArcGIS platform. These companies have improved the way project managers coordinate staff assignments. Moreover, PenBay Media and GISi serve the EPA by providing the agency with spatial insights and helping it get the most out of its GIS at the program level.
Learn more about GISi. Learn more about the Esri ArcGIS platform.
