Editor’s note: How do you keep less motivated students from turning into zombies when teaching geospatial analysis? Edward González-Tennant, assistant professor of anthropology and director of the GIS program at Monmouth University in New Jersey, found an effective and entertaining approach.
GIS educators face unique challenges regarding the teaching of geospatial analysis. While job opportunities and an interest in mapping attract many students, others are less likely to see the value of GIS as it relates to their scholastic or career interests. Reaching reluctant pupils requires innovative ways of connecting geospatial analysis with interesting topics.
Crafting interesting lessons that teach distance analysis and habitat modeling can be especially challenging for educators. The concepts are technical and the process seemingly complicated because it involves arranging and changing data to accomplish various analyses. To engage students in these topics, I combined them with my personal interest in all things zombie.
As the director of the Monmouth University GIS Program, I am primarily involved in student recruitment activities as a guest lecturer and campus-wide presenter. As part of Monmouth University’s 2011 GIS Day events, I gave a presentation entitled “Popular Culture and GIS: Using Geospatial Technologies to Model and Prepare for the Zombie Apocalypse.” My geospatial analysis of a potential zombie apocalypse was so popular that I am often asked to deliver some version of the talk to various classes and groups.
My decision to use the zombie apocalypse as a teaching tool was based on its use by other agencies, including the Centers for Disease Control and Prevention Zombie Preparedness pages on emergency preparedness and the Missouri Department of Conservation’s Flesh Afield site about invasive species.
In my case study, I modeled a zombie apocalypse in Monmouth County, New Jersey, as a way to introduce students to specific geospatial skills while keeping their attention. The analysis focused on two time periods: the initial outbreak and the predicted distribution of zombies in the following weeks and months. This analysis required students to consider four basic questions.
- What are the basic characteristics of a zombie horde?
- Which locations are the most susceptible to zombie outbreaks/contamination?
- Which forms of spatial analysis are most appropriate for modeling a zombie apocalypse?
- What might the postapocalypse spatial patterning of zombies look like?
Answering the first question involved grappling with a classic debate among zombie fans. Do zombies shuffle slowly, as in the classic Night of the Living Dead movie, or quickly, as in more recent films like 28 Days Later? Ultimately, I decided to model the horde’s movement at a steady 1.5 miles per hour, based on zombie hordes in novels and movies that tend to shuffle slowly across the landscape.
Which Way Will They Go?
The second question addressed potential zombie outbreak locations. Traditionally, zombies often rose from their graves due to radiation, voodoo, and other causes. Today, zombie outbreaks are viewed as the result of some kind of pandemic. My analysis used this second scenario, given its increased popularity in recent years.
Modeling a zombie outbreak provides an excellent opportunity to teach students about various distance modeling techniques and think critically about the strengths and weaknesses of each approach. These approaches included buffer analysis, Euclidean distance, and network analysis. The roads and health care facilities data used for theses analyses are available from the New Jersey Geographic Information Network.
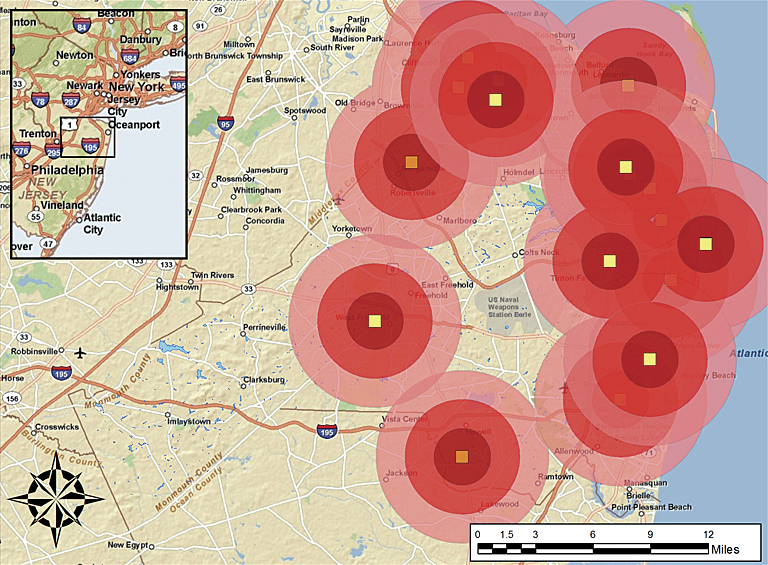
Simple buffer analysis places radiating circles corresponding to expanding distances/times around the medical facilities. The innermost circle corresponds to one hour (1.5 miles, or 7,920 feet) of movement by the zombie horde. The middle circle corresponds to two hours (3 miles, or 15,840 feet) of movement, and the outermost circle corresponds to three hours (4.5 miles, or 23,760 feet) of movement.
Of course, there are drawbacks to using buffer analysis. Planning movement and actions based on buffer analysis is hindered as exact measurements are unavailable. Another form of analysis is required to produce specific distance measurements.
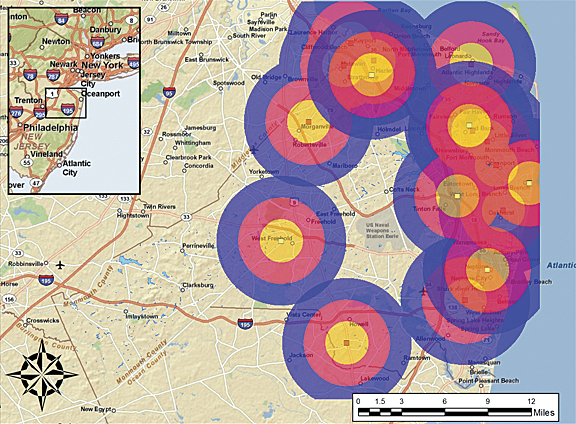
Euclidean analysis calculates, for each point in space, the actual distance from a source point. This form of analysis provides more accurate data. Users can see the exact distance measurements between various locations and any given outbreak point.
Euclidean analysis has its drawbacks as well. While returning a more accurate measurement, this form of distance analysis treats the landscape as an empty Cartesian plane and is little more than a measure of distance “as the crow flies.”
Network analysis creates an area (polygon) that encompasses all accessible streets within a given distance or time. Sometimes referred to as service area analysis, this form of spatial analysis takes into account the placement of streets and is often used for logistics planning.
This form of analysis is appropriate for analyzing the spread of a zombie horde. Zombies are more likely to wander along streets than cross open fields, bodies of water, or other areas. Network analysis not only takes features of the landscape into account, but it also returns exact measurements like Euclidean distance analysis. It is a preferable method for predicting the spread of a zombie horde, and this is particularly true given a 1.5 mph rate of movement radiating out from medical facilities.
Predicting Zombie Habitat
While predicting the movement of zombies at the beginning of the zombie apocalypse is certainly useful for planning your way home, survivors will be faced with additional obstacles in the days and months following the initial outbreak. This is where site suitability analysis comes in handy. Suitability modeling typically answers the question, Where is the best location? This could be the best location for a new road, pipeline, housing development, or retail store. In this case, it answers the question of where zombies are most likely to congregate following an outbreak.
Suitability analysis is a more complex process than distance analysis. Several variables are taken into account and modeled in relation to one another. I chose fuzzy logic to model the post-apocalypse distribution of zombies. This analysis is covered in detail by the Esri online course “Using Raster Data for Site Selection (for ArcGIS 10).” Fuzzy logic is useful when the definition of phenomena and things affecting them are imprecise. It is typically used to model suitable habitats for plants and animals that do not follow mapped features the way (living) humans do.
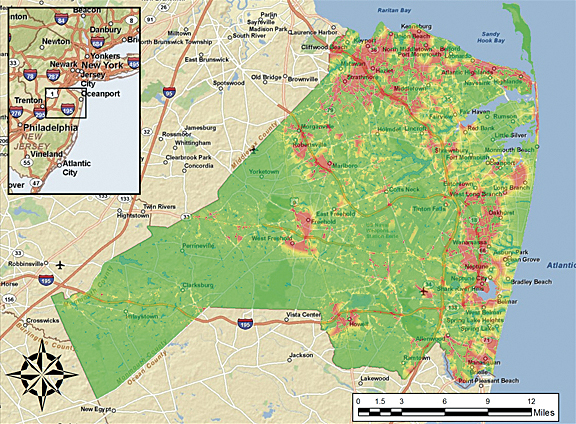
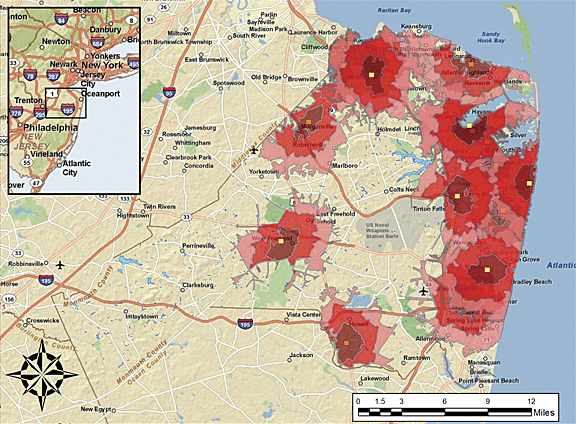
The preliminary zombie habitat model used three types of data. The first variable, land use, is available as a download from the New Jersey Geographic Information Network. The data was reclassified and higher weights assigned to areas of human disturbance. Places like shopping centers and industrial areas are likely to attract zombies. Alternatively, open fields and swampy areas were given less weight because it is less likely that zombies would congregate in those areas.
The second variable involved classifying bodies of water. These areas were classified as deterrents to zombies because they caused zombies to slowly shuffle away given the lack of human population.
The third variable was major highways. These areas were classified as highly likely to have zombies since popular culture always shows these areas as the location of secondary outbreaks. These two datasets were downloaded from the US Census Bureau 2010 TIGER/Line Shapefiles website.
Areas with the highest probability of zombies following the initial outbreak were symbolized with red. This was always an interesting moment in the zombie presentation because students immediately related to the results of this analysis.
Light Approach, Serious Learning
This approach has been an entertaining and useful introduction to spatial analysis for my students at Monmouth University. It invites students to think critically about space. The class discusses why network analysis is the most appropriate geospatial technique for modeling the initial spread of zombies given that they move primarily along roadways at an average speed of 1.5 mph and spread out from health care facilities. We review why fuzzy logic is suitable for modeling the postapocalyptic distribution of zombies, which is similar to the ways animals ignore political boundaries and manmade features.
For more information on this project, visit my blog post on it. In addition to images showing the various analysis techniques, visitors can download a Microsoft PowerPoint file for use in classroom presentations. The file includes additional background on zombies and can be modified with new images to accommodate new geospatial analysis of zombies. Please credit Edward González-Tennant if you use the file or accompanying images.
For more information on Monmouth University’s GIS program, visit www.monmouth.edu/academics/GIS/default.asp.
About the author