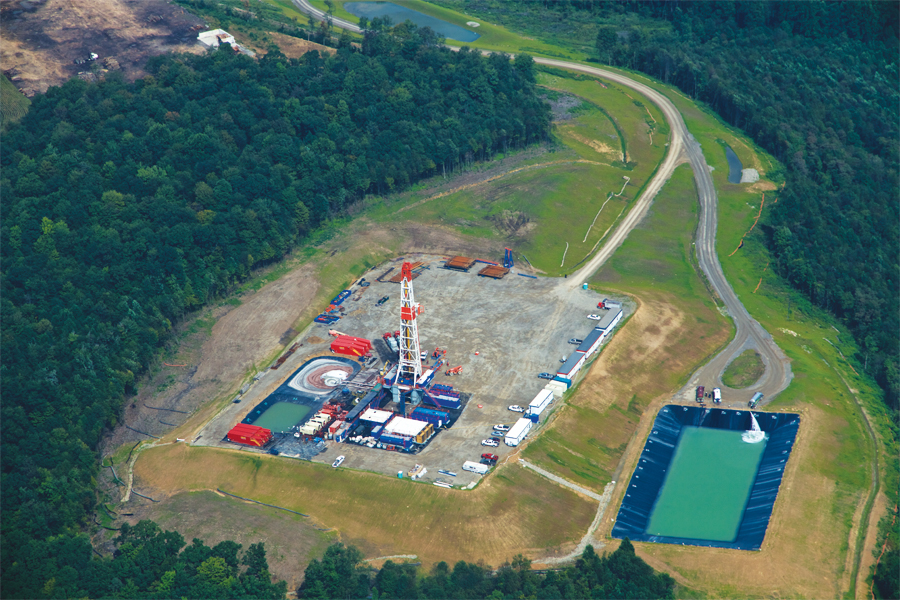
More than 150 years after the first commercial oil well in the United States was drilled in Titusville, Pennsylvania, the state finds itself in another major energy boom.
While oil, gas, and coal extraction have been ongoing across the state since that time, advances in shale gas drilling have increased Pennsylvania’s gross natural gas withdrawals from approximately 175,000 thousand cubic feet (Mcf) in 2006 to more than 3.2 million Mcf in 2013 (US Energy Information Administration).
The proliferation of drilling has sparked concerns about health and environmental impacts, underscoring the need for accurate, accessible data. For nearly four years, the GIS Lab at the Carnegie Museum of Natural History (CMNH) has utilized the ArcGIS platform to collate, check, and present data from Pennsylvania’s Department of Environmental Protection (DEP) in a more accessible and functional format.
Identifying the Problem
It all started with a simple question in 2011—how many Marcellus shale wells are there in Pennsylvania? [Marcellus shale is black, low density, carbonaceous shale from the Middle Devonian age that occurs beneath much of Ohio, West Virginia, Pennsylvania, and New York as well as small areas of Maryland, Kentucky, Tennessee, and Virginia. (Geology.com)] Finding the answer proved to be much trickier than expected.
Early on, researchers in the GIS Lab found evidence that the press and other organizations were drastically overestimating drilling because they were using the number of well permits to indicate the number of wells drilled. Even for relevant datasets, the rapid expansion in drilling overwhelmed the regulatory infrastructure, which led to inconsistencies between datasets regarding Marcellus shale classification as well as clerical errors of all sorts.

Increased attention to detail from the DEP and a new data distribution system led to improvements over previous years in which the number of well reporting errors went from more than 10 percent to less than 2 percent. However the data is still not offered in an intuitive format that facilitates examination by industry, regulators, policy makers, or landowners.
To get a clearer picture of shale gas development across the state, researchers in the GIS Lab decided to unify the publicly available reports into a more cohesive dataset that was assessed for accuracy and completeness and allowed users to access any information on Pennsylvania wells with simple queries. The small staff in the GIS Lab needed an easily repeatable process to keep the dataset current with the growing natural gas industry.
Repeatable Processes and Clear Documentation
Researchers started organizing the datasets using ArcGIS for Desktop. They soon found ModelBuilder to be an invaluable tool for clear documentation and process reproducibility. They used ModelBuilder to develop a set of four models that reorganize the state-issued shapefiles and comma-separated values (CSV) files into a geodatabase while also generating summary fields on key topics.
Within the models, custom error-checking Python scripts cross-reference between datasets, ensuring a level of scrutiny beyond simply reorganizing the data. For example, a producing gas well that is lacking a SPUD date (the date drilling was initiated) would be flagged as having a SPUD error. Researchers wanted to highlight wells with errors so that dataset users could handle those cases as they saw fit. This also allows identification of operators or locations that have a history of performance concerns.

The final geodatabase contains a point feature class of unconventional (e.g., horizontal or hydrofractured shale) gas wells, broken down into permitted, drilled, or producing wells (or unknown if records are unclear). Each well is linked to associated records within 10 supplementary tables via relationship classes. These tables include data from all related reports, such as gas production, waste, and compliance.
Most important, ModelBuilder made the process easily repeatable and drastically reduced update time. Although the first dataset took more than 10 months to produce and nearly two weeks to update, subsequent updates with ModelBuilder generally take only a few hours.
Elucidating Trends in Gas Development
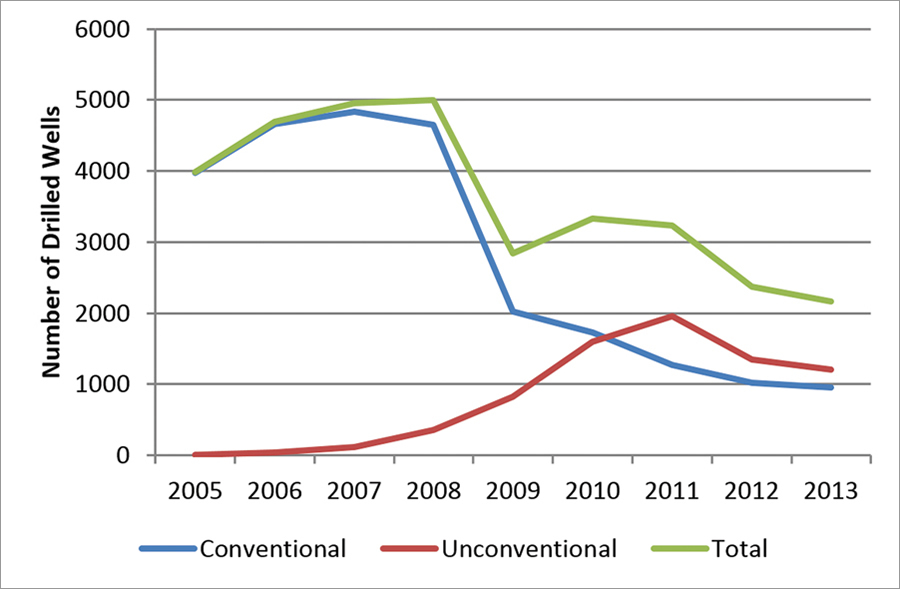
Using ArcGIS to transform the available data into a more intuitive format has facilitated research within CMNH and beyond. For example, comparison of the final unconventional wells dataset with an intermediate all wells dataset makes it clear that while there has been a boom in gas production, the state has seen an approximately 50 percent reduction in the number of gas wells drilled annually as fewer conventional vertical wells are drilled.
Researchers in the GIS Lab have also used the dataset to demonstrate the importance of existing road and pipeline infrastructure in determining well placement. Using the Near tool in ArcToolbox, researchers calculated the distance of all 467 Marcellus wells and 1,000 replicates of 467 random points to the nearest major road and pipeline within a four-county study area. Not surprisingly, gas wells were clustered significantly closer to existing pipelines and major roads. Beyond CMNH, GIS professionals working across industry, government, and nongovernmental organizations (NGOs) have embraced the dataset for their own analyses. At last count there were more than 250 regular users of the dataset.
Reaching Beyond GIS Professionals
While large natural resources or conservation organizations have sufficient GIS staff to utilize the CMNH geodatabase or produce their own dataset, small organizations and private landowners typically do not have access to these resources. For this reason, the GIS Lab has been leveraging ArcGIS for Server and ArcGIS Online web maps and applications to share not only the data but also information to a broader audience.

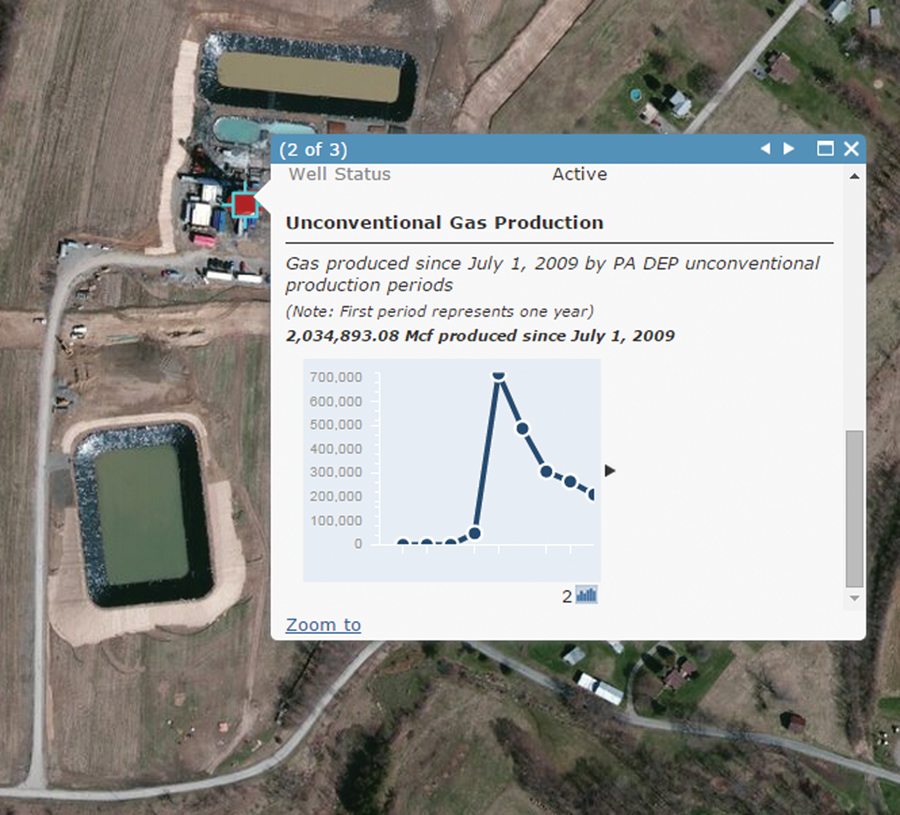
Using these tools, the GIS Lab created a map service that was added to an ArcGIS Online map. Using data filters, the lab created custom pop-ups that are unique for each well stage. For example, clicking on a producing well brings up a pop-up containing a line graph showing the amount of gas extracted from that well over time. Sharing the web map via the Classic Viewer web mapping application allowed the GIS Lab to quickly deploy the map on its website.
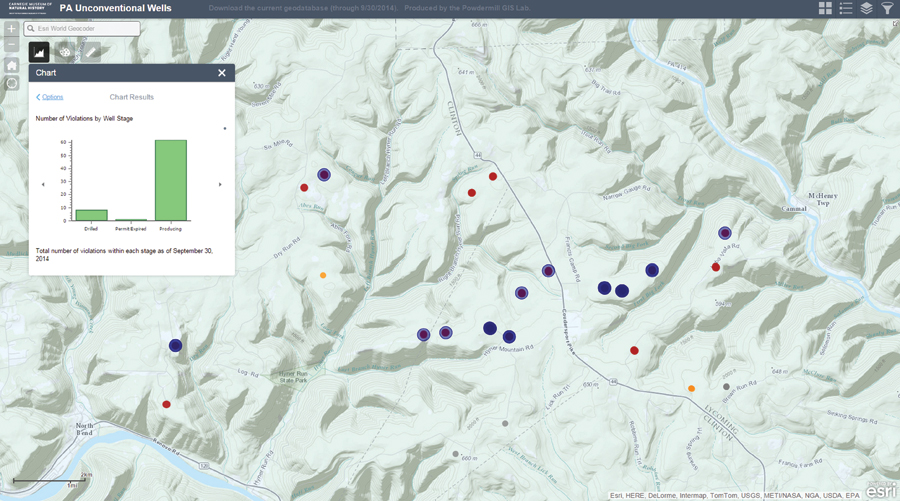
More recently, the GIS Lab has adopted the new Web AppBuilder for ArcGIS to offer additional functionality, with the intention of providing customizable results. Configuring the chart widget has allowed users to access information beyond a single well. The option to apply a spatial filter allows users to get the type of distilled information that was previously only accessible to a GIS professional.
For example, the landowner considering whether or not to lease his land can view the combined production of wells in the area. Those concerned about the impacts of drilling in their area can get a tally of wells or violations in their county. In addition, the query and draw widgets provide the user with a custom mapping solution.
Using GIS to More Clearly Present Data
Recently, Pennsylvania auditor general Eugene DePasquale cited the clarity of the CMNH dataset in a review of the state’s own efforts tracking development. He stated, “The researchers at the Carnegie have demonstrated that it is possible to provide a more cohesive picture of shale gas drilling in Pennsylvania.” This praise and the widespread use of this dataset are a testament to the power of GIS to more effectively present data on energy development. While spreadsheets with coordinates are an easy way to store and share data, mapping these points and their associated information makes the trends immediately clear.
For more information, visit maps.carnegiemnh.org or contact Jake Slyder, GIS manager at the Carnegie Museum of Natural History.
About the Authors
Jake Slyder is the GIS manager at the Carnegie Museum of Natural History.
James Whitacre is a GIS specialist at the University of Illinois.
John Wenzel is the director of Powdermill Nature Reserve at the Carnegie Museum of Natural History.

