In its law enforcement efforts, the City of Baltimore uses mapping and spatial analysis as a fundamental tool for making decisions and efficiently targeting resources.
Violent crime is a significant problem in the United States. According to national figures compiled by the FBI, homicides claimed more than 14,000 lives in 2013 with 69 percent of those deaths attributed to firearms. Youth are disproportionally affected. Homicide was listed by the Centers for Disease Control and Prevention as the second leading cause of death among 15 to 24-year-olds in 2012.
Mapping and spatial analysis of crime and risk-related data is an essential part of any violence prevention program, whether driven by law enforcement, public health, other government agencies, community-based organizations, or nonprofits. Many of these organizations work on multiple projects together. Maps are a great way to communicate the many effects of crime on health and well-being to all audiences.
Although there are many research studies about using GIS for crime prevention and health analysis, applying GIS to the prevention of youth violence is not a well-covered topic. Using maps to tell this story can be a powerful tool for intervention.
Unfortunately, crime data is not always mapped and visualized efficiently. There is an overreliance on certain techniques, such as density methods. Each spatial technique has advantages and disadvantages. Many mapping and analysis capabilities in ArcGIS have been used by the city to help visualize the relationship between crime incidents, risks, victims, and offenders and tell a timely story from outreach workers to senior city leadership.
In the Baltimore City Health Department, three youth violence prevention programs—Operation Safe Kids, Safe Streets, and Dating Matters—use ArcGIS Online, publicly available data from Open Baltimore, and confidential data. Many of these spatial products created are used to guide city-wide prevention efforts, such as the Violent Crime Reduction Enhancement Initiative led by Mayor Stephanie Rawlings-Blake.
Safe Streets Baltimore, an integral part of violence prevention in Baltimore, is a community-based outreach and conflict mediation program designed to prevent shootings. Outreach workers and specialized violence interrupters are given maps showing the locations where violent crimes have been committed and hot spots maps showing areas with high concentrations of crimes to guide them.
The Baltimore Community Map on ArcGIS Online provides a quick and easily understood view of the community. The default crime symbology in ArcGIS can be edited to display the locations of violent crimes. Pop-ups can be configured to supply the dates of occurrence and other information. Crime data often overlaps, so changing symbol levels in ArcMap layer properties and using Maplex Label Engine (now included with ArcGIS for Desktop) helps prioritize certain types of crimes such as shootings and homicides. When looking for gun offenders and other key individuals, effective labeling helps to make maps more readable.
Plan for Today and the Future
Site selection is crucial for violence prevention programs. Selecting sites based on a set of criteria improves the efficiency and effectiveness of program operations. In addition, maps and map products can be a requirement for obtaining federal violence prevention grants.

Another of the city’s youth violence prevention programs, Dating Matters, is a Centers for Disease Control and Prevention-funded research and educational program for middle school students. Using ArcGIS, schools for the program are identified based on factors such as location in an area with high poverty levels or location in or near areas with high occurrence of violence. This data is given to project directors.
Site selection maps produced in ArcGIS have also been recently used in two successful grant applications made by the city. One of the maps showed rates for youth under 25 years of age, who were shot, clustered using local indicators of spatial autocorrelation (LISA). Another map illustrated shooting victim locations over a period of several years, grouped by police posts and displayed using bar or column charts.
More Than Dots on a Map
Lastly, maps are key to the strategic decision-making process for reducing violent crime and troubleshooting nuisance areas where crime frequently occurs. In addition to density mapping, ArcGIS has other functionality for visualizing crime and risk-related data. Mean and median centers of shootings by year can be created using tools in the Spatial Statistics toolbox. The Integrate and Collect Events tools help visualize repeat addresses.
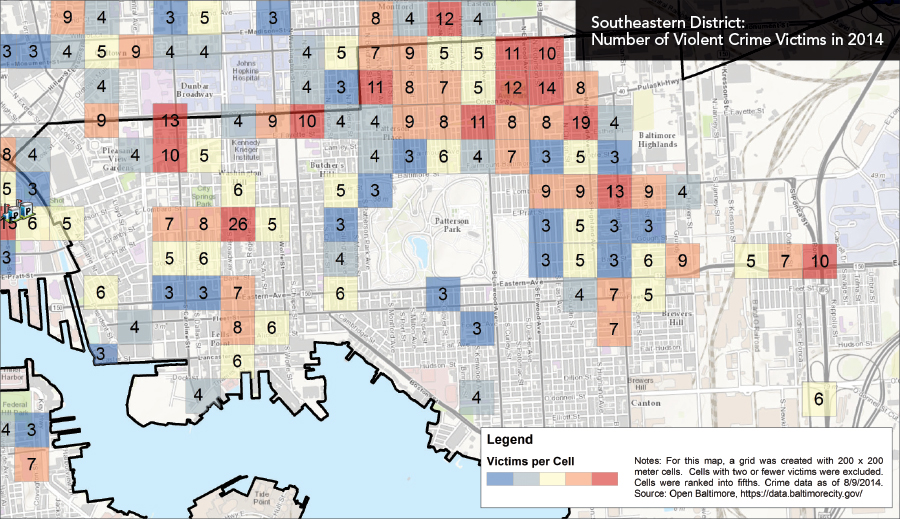
Creating a fishnet (grid) in ArcGIS allows various types of crime data to be summarized and compared using spatial joins. One advantage of this technique over density mapping is that the number of crimes in each equal-sized cell can be labeled. Fishnet maps are an easy way to communicate the concentrations of crime in specific areas to senior leaders.
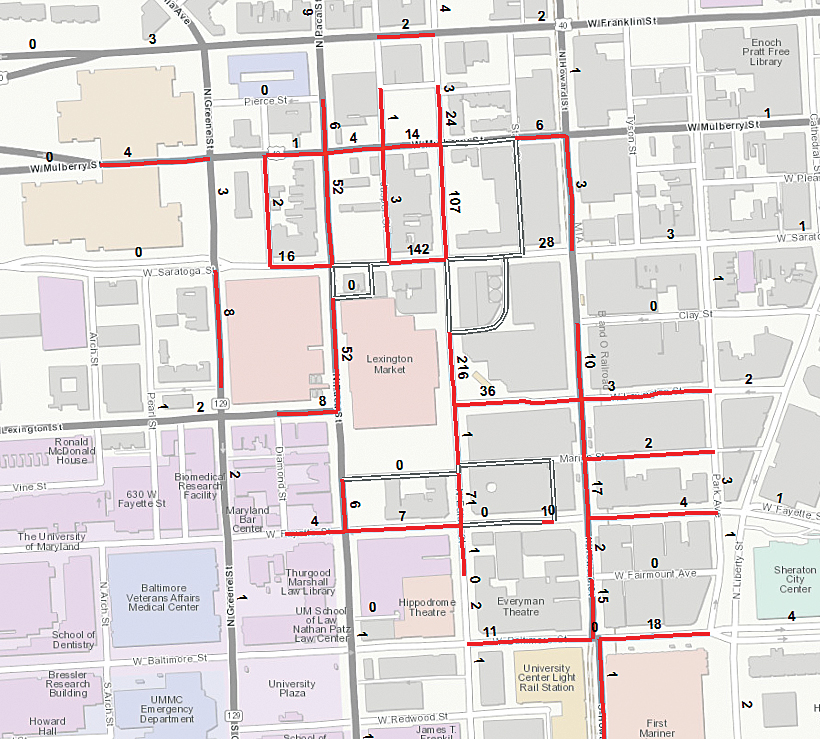
Crimes and enforcement efforts are often concentrated in specific segments of streets or microplaces. Spatially joining point data to street segments can show this. Other pattern-oriented tools available in ArcGIS include global and local LISAs and regression tools that provide support for choosing one area over another for an intervention. In addition, these analyses can help explain why local variation occurs, even in high-risk areas.
Mapping Risks of Future Crimes
Traditionally, crime incident data has been mapped to include offender and victim information. However, many researchers and practitioners are also mapping risks or creating risk terrain models—namely shootings and homicides—to predict crimes. Densities of different risks can be overlaid and summed using the Raster Calculator and other raster-based functionality. Data in models can include locations for gun offenders, liquor stores, and vacant residences. Raster layers can be transformed using vectorization. Past, present, and future crime incidents can be summed to help validate the model.
Getting Maps Online
Mapping more than crime incidents is important. Ultimately, getting good maps of crime, risk, protective factors, and community assets online can help all partners better troubleshoot crime’s causes and distribution, whether that distribution is spatial, temporal, or both. ArcGIS Online is a great way to create an interactive map that displays the names of assets and contact information on the fly for planning purposes or sharing with a wider audience.
For more information, contact Jonathan Gross.
About the Authors
Jonathan Gross is an epidemiologist with the Baltimore City Health Department, Office of Youth Violence Prevention.
Shannon Cosgrove is the deputy director of the Mayor’s Office on Criminal Justice.

