
Try Esri Redistricting
Explore an overview of Esri Redistricting and resources to get started.
Experience what’s possible with Esri Redistricting through curated series of tutorials.
Try Esri Redistricting
Create and edit redistricting plans

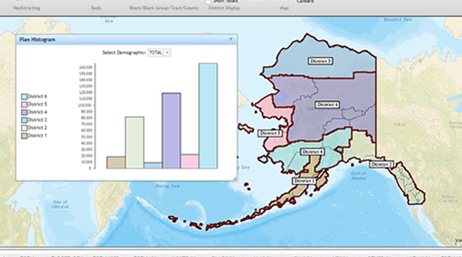
Analyze and review redistricting plans

Collaborate with other users and groups
Read articles from the Esri Redistricting team. Connect to ask questions and learn more.
Discover recently added capabilities.
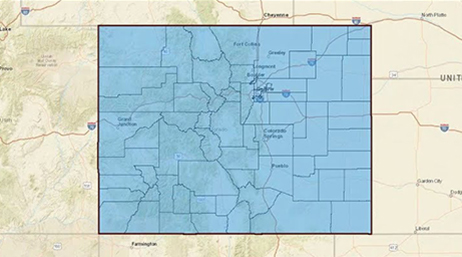
Esri announced the latest release of Esri Redistricting and its adoption by the State of Colorado.
Quickly find answers to commonly asked questions.
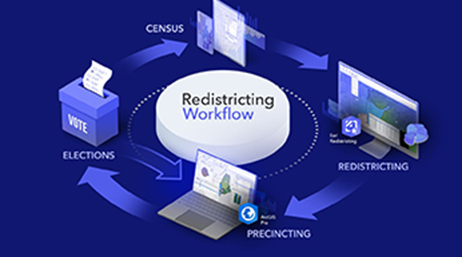
The Census to elections merry-go-round

2020 Census data: Let the redistricting begin

Support for new apportionment procedures
Find answers and information so you can complete your projects.
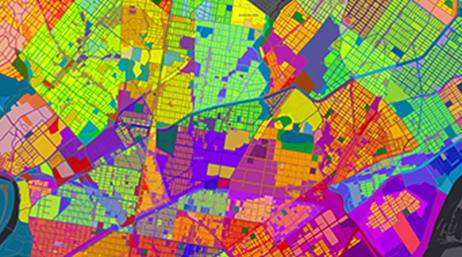
Bringing clarity to the redistricting process
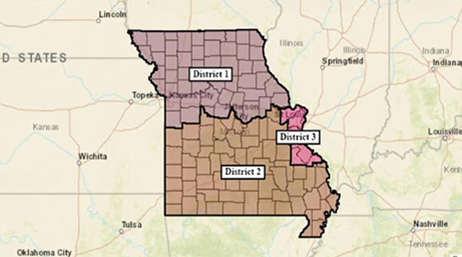
Create and Merge a Regional Plan
Integrate plans and charts
Exchange ideas, solve problems, and build relationships with the Esri Redistricting community.
Do you have an idea to improve Esri software? Many of our capabilities started as suggestions from our users.
Get inspired by user projects, keep up on product news, and be among the first to learn about updates.
7:00 a.m.–5:00 p.m., Monday through Friday (PT)