In the 2024.1 June release, ArcGIS for Power BI has enhanced tooltips and popups. Popups no longer need to block your map and it is much easier to close them. To meet the needs of both Power BI and ArcGIS users, the native Power BI tooltip is used to reveal information from Power BI data layer and Feature information is used to display information from ArcGIS layers.
What is Tooltip and Feature information?
So, what is Tooltip and Feature information? You can visualize the Power BI data you added to your report with different visualizations to like maps, charts, tables, and others. After your data has been visualized, to get more information on the visualized data, one way is to use hover to see a popup. This popup is Tooltip. Power BI data layer may not be enough to be used in your report. To get more information, you could use ArcGIS data to enrich your report and provide more information for reporting and analyzing. ArcGIS for Power BI not only maps the ArcGIS data to your report, but also bring the data in to provide contextual information. To view that ArcGIS data, you will see it from the Feature information pane when you click on the mapped features.
Why do you need tooltip and feature information in your Power BI report?
Power BI tooltip provides additional details or explanation about data points. It provides contextual insights using interactive actions and reveals detailed information that may not easily visible in the main visualization. More importantly, Power BI tooltips can be customized.
In the image below, when hovering on a mapped data you are interested in, you will see the detailed information about this data point from the tooltip, including the calculations and contextual information to help you better understand the data. You can make comparisons related to the data point being hovered over. And the tooltip text and background style can be customized based on your preference.


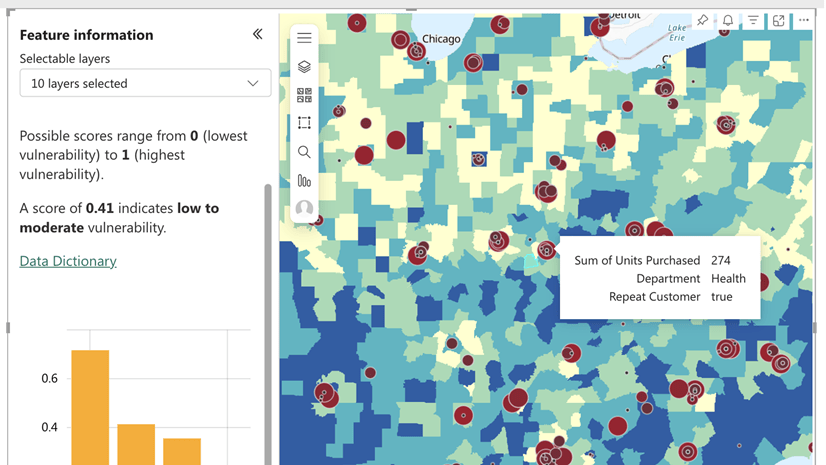
Feature information brings ArcGIS technology to your report, providing contextual information and displayed side by side in a clean way. You might want to utilize as many ArcGIS resources as possible to better help with your report. Now, with Feature information, not only can you bring the ArcGIS layers to your report, but also get more information from ArcGIS layers.
The image below shows what Feature information looks like in ArcGIS for Power BI. You could see both Power BI tooltip and Feature information at the same time. Compared with other Power BI visuals, it contains texts information, interactive charts and others in a single panel within ArcGIS for Power BI. Additionally, with the information on the Feature information panel, it will provide sufficient context about the Power BI data points using ArcGIS.
")
How Tooltip and Feature information works
How do you use Power BI tooltips and Feature information in ArcGIS for Power BI? To use a Power BI tooltip, you will need to add data to the Tooltips field well in ArcGIS for Power BI.

To customize the tooltip, you will need to go to Visualizations pane and find Tooltips under the General tab. Here, you can toggle on/off tooltips, choose the default tooltip or use report page as tooltip, customize the text format and background.

To see the Feature information pane, once reference layers have been added to the map, you will need to go to Visualization and find Feature information under the Visual tab. Here, you can toggle on/off the Feature information panel and change the position of the panel.

Hopefully, you will find the Power BI tooltip and Feature information helpful when building your Power BI report using ArcGIS for Power BI. Please let us know if you have any questions. Your questions, ideas or concerns will be addressed in the ArcGIS for Power Esri Community page.

Article Discussion: