Developers

Voxel layers - exploring world atmospheric temperature and pressure with ArcGIS API for JavaScript

Multidimensional datasets are complex and hard to understand without good visualization tools. In this blog post we’ll explore a dataset representing atmospheric temperature and pressure measurements using ArcGIS API for JavaScript.
View live application

First of all, some definitions: atmospheric pressure is the force exerted on a surface by the air above as gravity pulls it to the Earth. The temperature at different levels of the Earth’s atmosphere is influenced by incoming solar radiation, humidity and of course by the altitude.

How can we measure temperature and pressure at such high altitudes?

The technique involves a low earth orbit satellite receiving a signal from a GPS satellite. When it passes through the atmosphere, the signal is refracted along the way similar to how light refracts when it passes through a lens. The magnitude of the refraction depends on the temperature, air pressure and humidity. This technique is called radio occultation and it produces highly accurate atmospheric measurements which are used in weather forecasting systems.

The dataset is provided by GeoOptics, a company which specializes in radio occultations for weather forecasts. Each occultation event lasts less than a minute and produces a linear profile of between 350 and 400 observations from the top of the atmosphere to the bottom. The data are acquired from the altitude of 30km down to the ground level. The initial dataset contains
around 600 occultation profiles that we then use to interpolate the measurements into a 3D surface. The geostatistical interpolation method is called Empirical Bayesian Kriging 3D. Using GA Layer 3D to netCDF, we exported the 3D surface to a netCDF file that can then be viewed as a voxel layer.

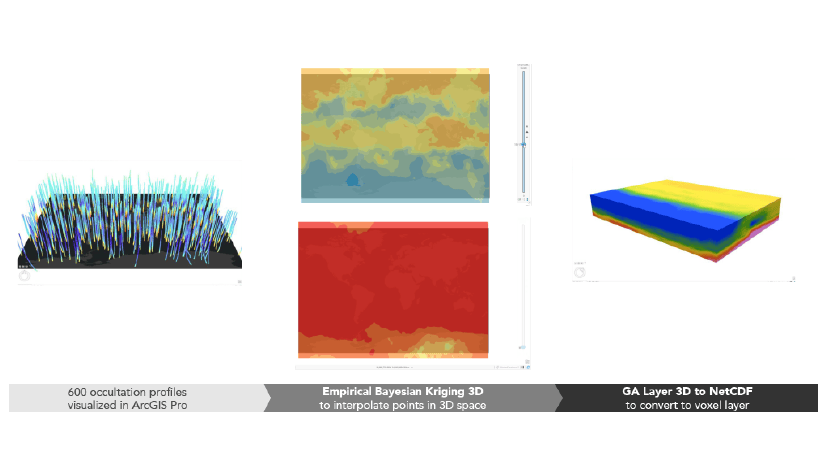
A voxel layer is a representation of multidimensional spatial and temporal information in a 3D volumetric visualization. In the Esri world this is a type of layer and we can publish it to ArcGIS Online and visualize in a browser. You can have a look at the voxel layer item here.


Exploring the voxel layer with ArcGIS API for JavaScript
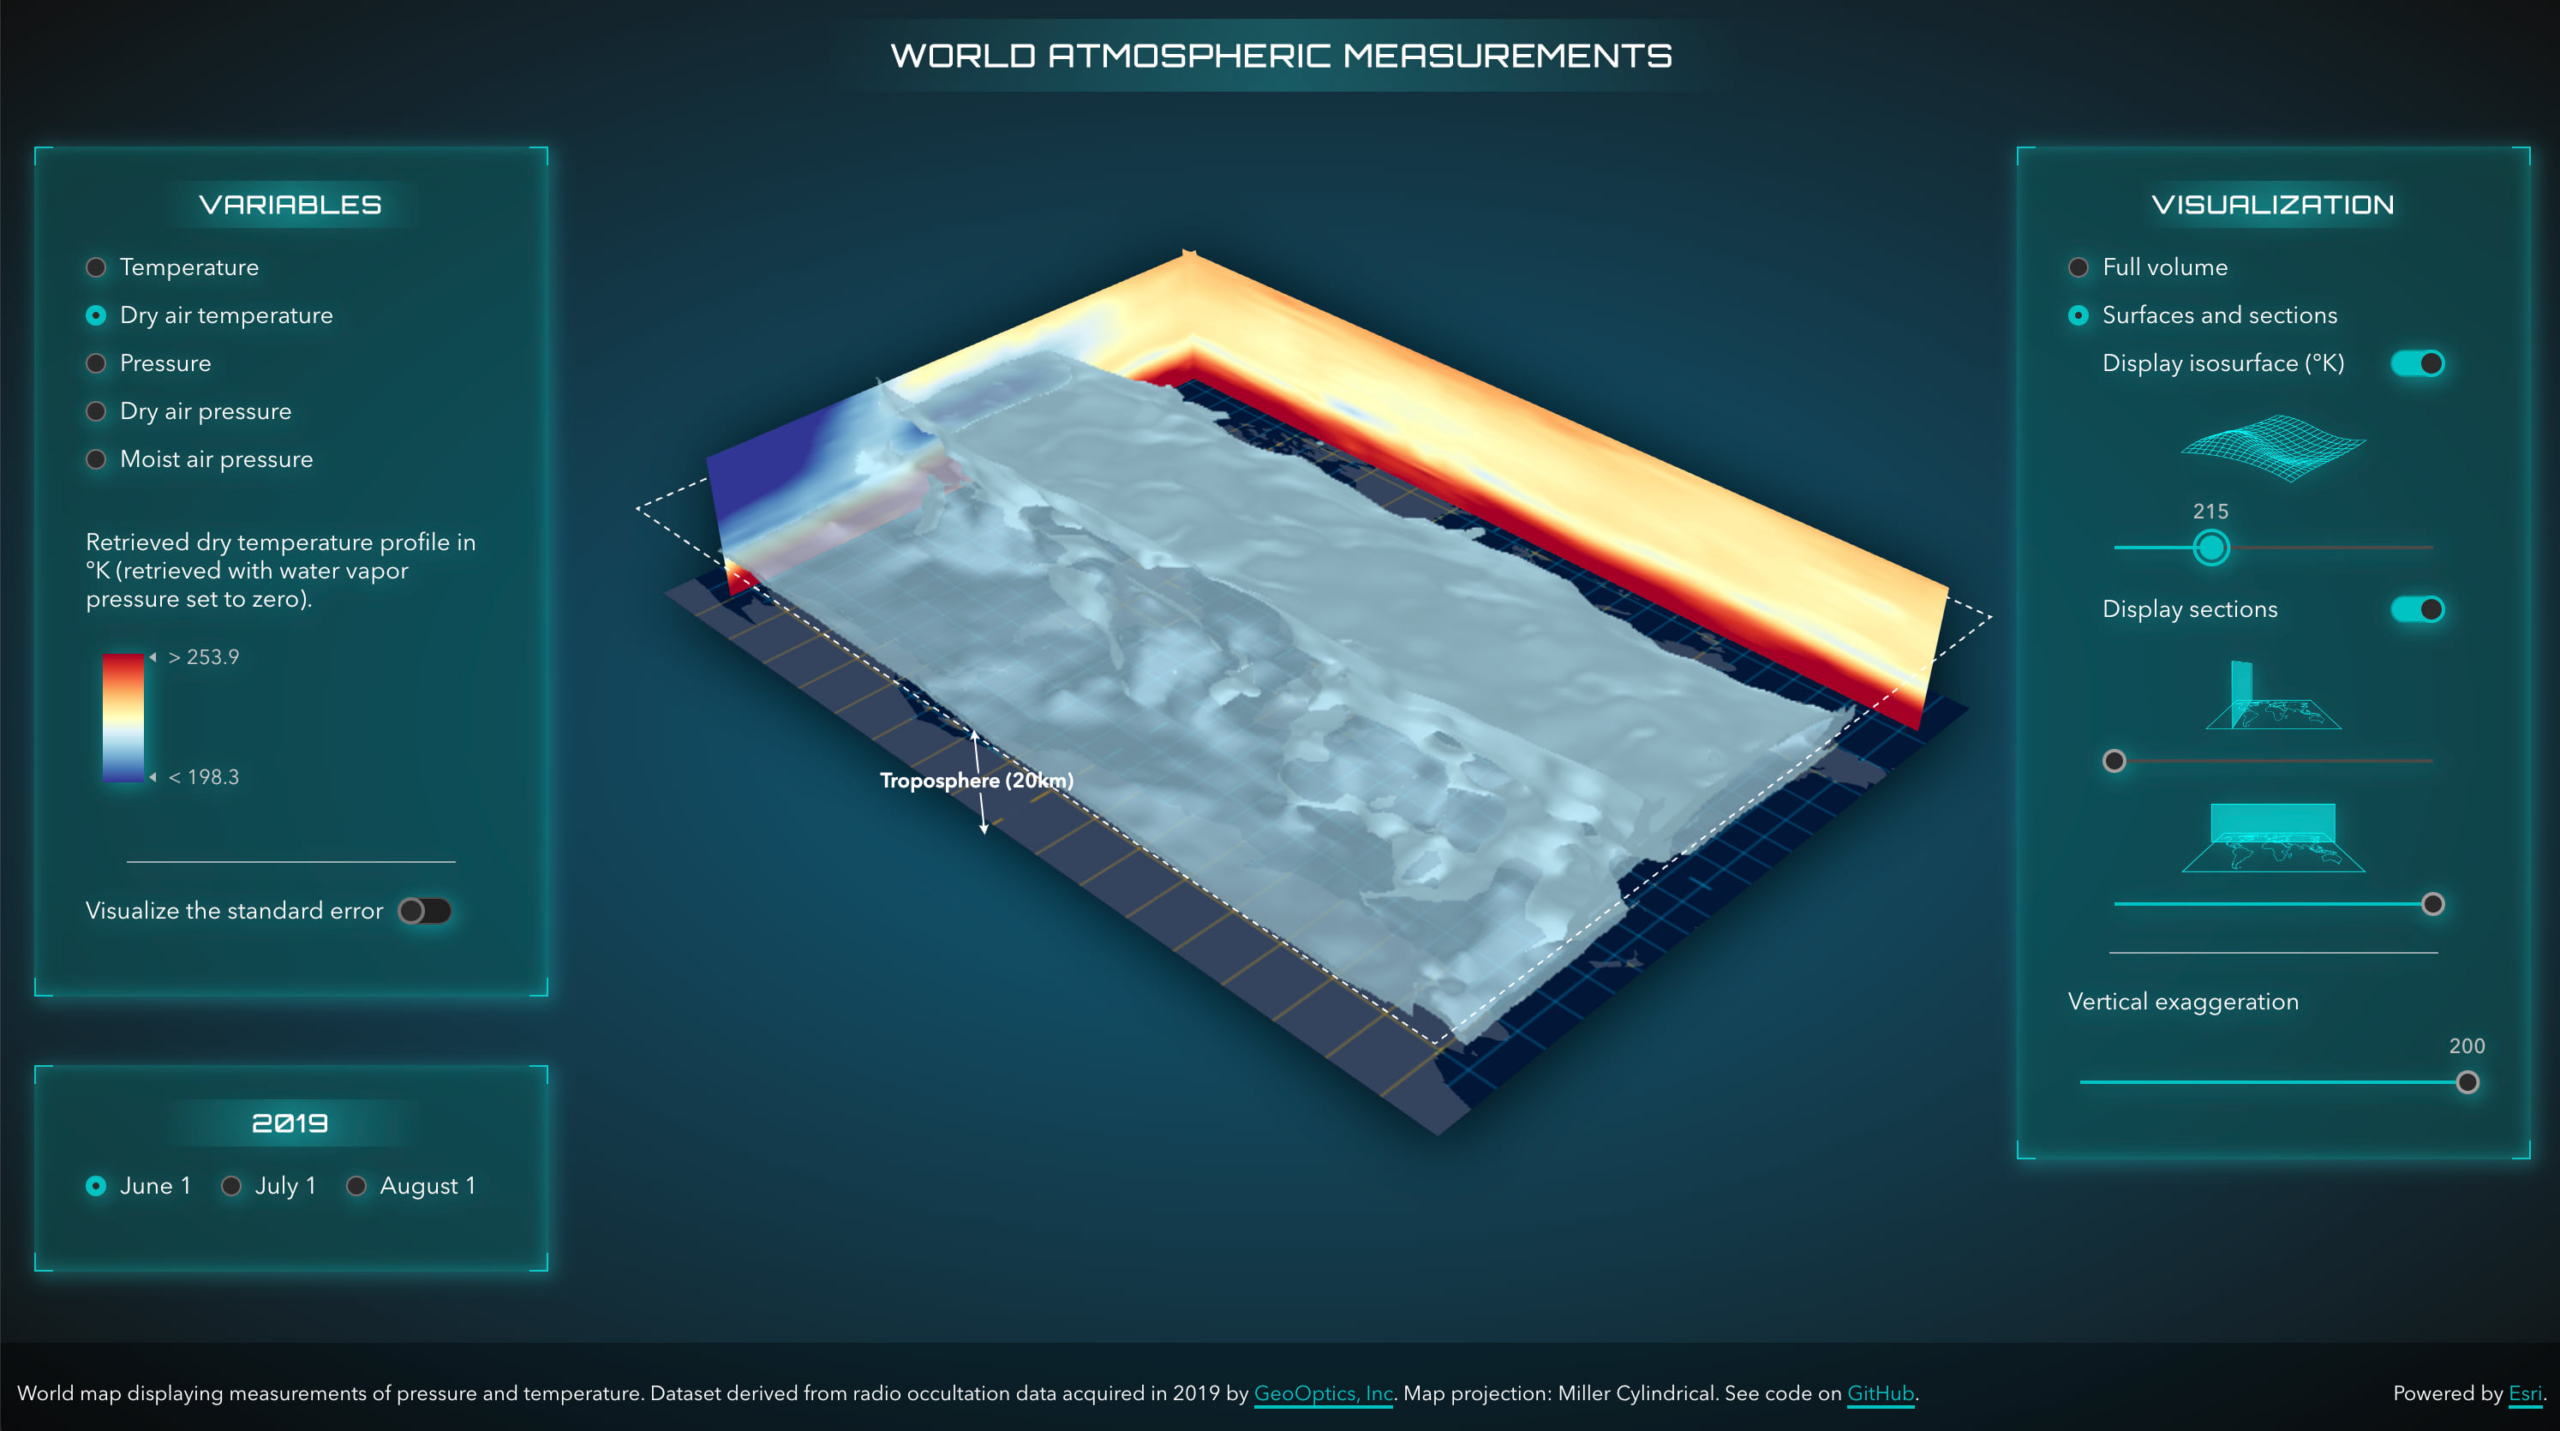
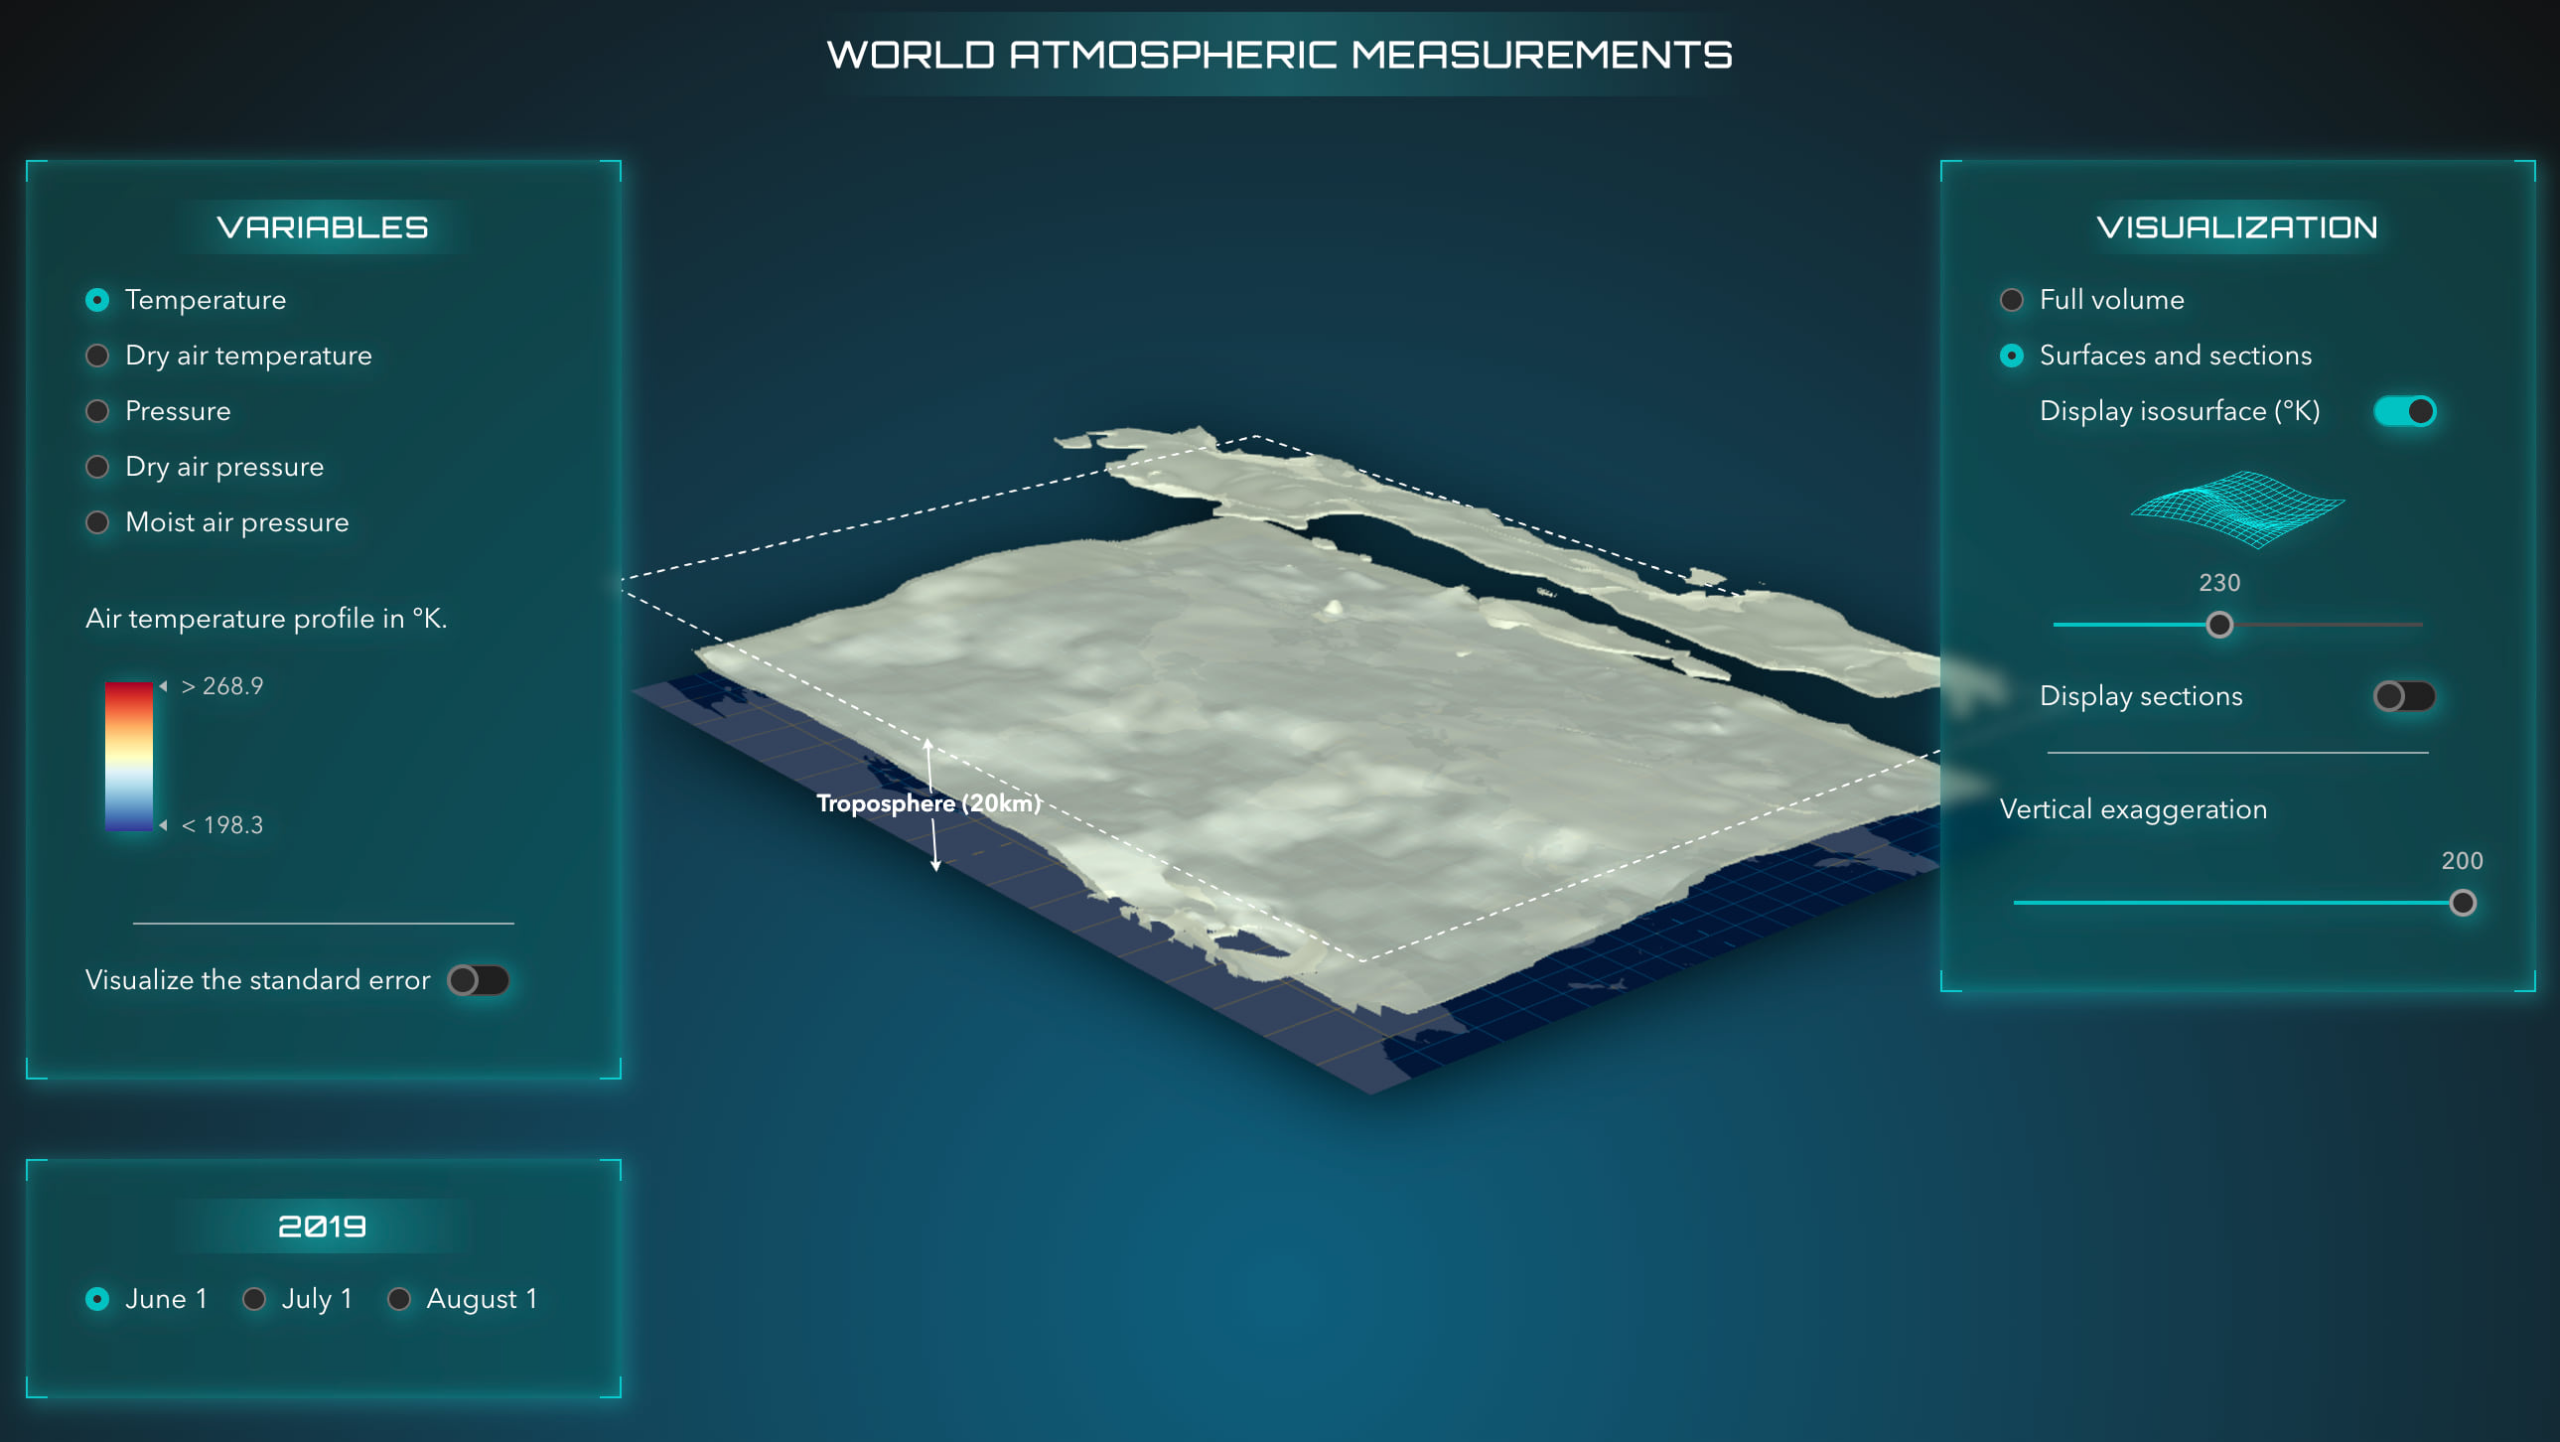
Variables

Our voxel layer stores the spatial coordinates x, y and z and values for pressure and temperature variables over three days.

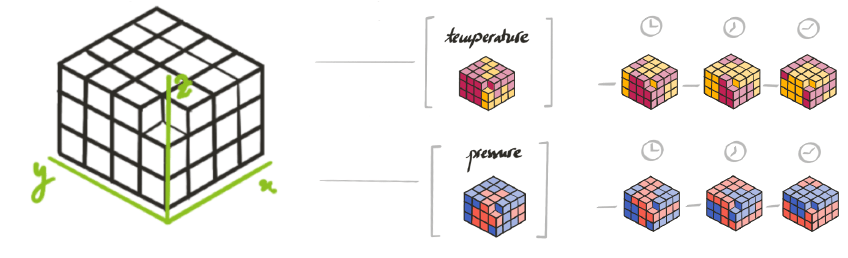
Within the ArcGIS API for JavaScript we can view information about variables by accessing the array voxelLayer.variables.

For example the temperature variable has this metadata:

{
  description: "temperature_Prediction",
  id: 10,
  name: "temperature",
  unit: "degree_K"
}

We can visualize temperature by setting the current variable id on the layer:

voxelLayer.currentVariableId = 10;

To change the time variable we set the time extent on view.timeExtent.

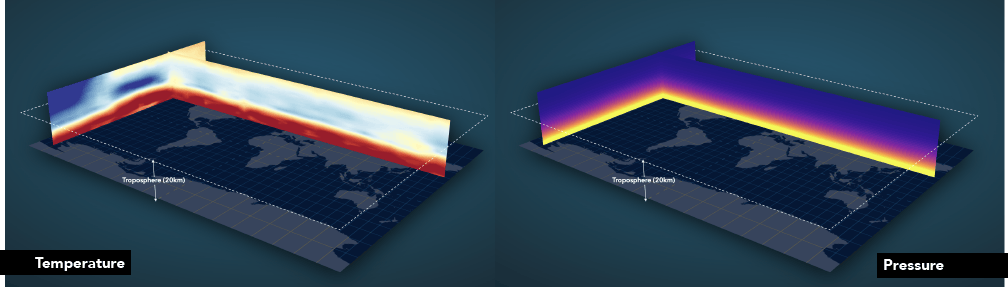
When we visualize them, we can compare the pressure and the temperature and we can see how pressure changes almost linearly with altitude, whereas temperature fluctuates much more because it doesn’t only depend on altitude, but also on solar radiation and humidity.

Rendering

A voxel layer can be rendered as a volume or as surfaces. To switch between the two we can set the voxelLayer.renderMode property to either volume or surfaces.
Depending on whether the variable is continuous or discrete, we can render it using stretch symbology or unique values. Each variable has its own symbology saved in voxelLayer.variableStyles. In our case we only have continuous values for temperature and pressure and we render them using the stretch symbology. variableStyle.transferFunction defines how the values are stretched between a minimum and maximum value that is associated with a color scheme. In case a variable has discrete values, the unique values are defined in variableStyle.uniqueValues.

Isosurfaces

If the variable is continuous we can create isosurfaces: surfaces with the same variable value. In a voxel layer we can visualize up to 4 isosurfaces at the same time.
Isosurfaces are stored as part of the variable styles. For example, to get the isosurfaces for a selected variable we can call: voxelLayer.getVariableStyles(variableId).isosurfaces.
In our demo application I am generating surfaces dynamically, to be able to explore the whole dataset. How does that work? When I switch to a new variable, I get the information about the range of values for that variable and connect that range to a slider. As the user moves the slider, I create a single surface with the value of that slider:


const createIsosurface = value => {
  const style = layer.getVariableStyles(selectedVariable.id);
  const color = layer.getColorForContinuousDataValue(selectedVariable.id, value, false);
  if (style) {
    style.isosurfaces = [
      {
        value: value,
        enabled: true,
        color: {...color, a: 0.8},
        // if the color is not locked, we can override it
        colorLocked: false,
      },
    ];
  }
};

Sections

A section is a two-sided vertical or horizontal plane cutting through a voxel layer. Creating sections allows us to analyze profiles in the data. In ArcGIS Pro a section can be locked, so that it also displays when changing the variable. Like this we are able to compare several variables. In ArcGIS API for JavaScript we can’t create locked sections, but we can visualize the ones created in ArcGIS Pro.
In our application I’m dynamically generating the sections, to be able to explore vertical temperature profiles at any location. To define a dynamic section we set a point that the plane should pass through, an orientation and a tilt angle for the plane:
The point is defined in voxel space, so we’ll need to retrieve the voxel dimensions:
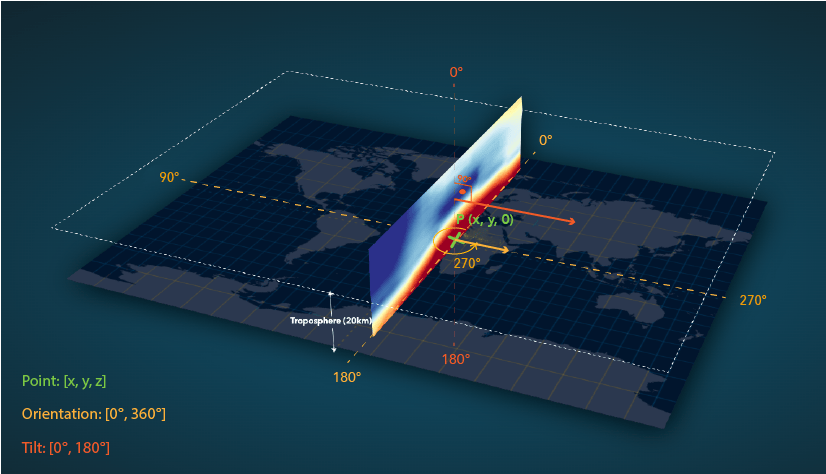
const dimensions = voxelLayer.getVolume().sizeInVoxels;

This is the code to generate a section that passes through the center of the voxel layer and is oriented from north to south like the image above:

layer.volumeStyles.getItemAt(0).dynamicSections = [
  {
    enabled: true,
    orientation: 90,
    tilt: 90,
    point: [Math.floor(dimensions[0] / 2), 0, 0],
  },
];

Note that the y and z coordinates of the point can have any value within the voxel space, with the given orientation and tilt, x is the coordinate that sets the position of the plane.
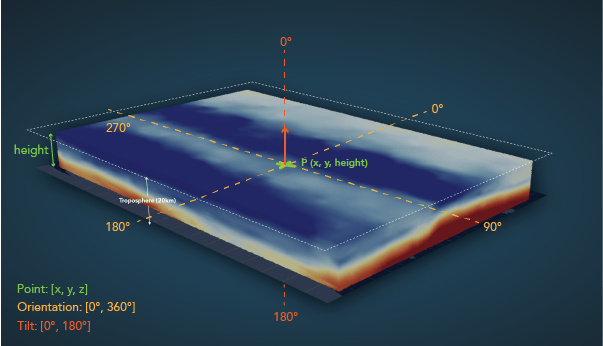
Slice the layer

Slices can be used to define areas of interest. Slices apply to both volume and surfaces visualizations. In our application we’re slicing the layer vertically from east to west and south to north, but also horizontally from top to bottom. Similar to a section, a slice is also defined by a point, an orientation and a tilt value. Let’s take the example of slicing from top to bottom. In that case the slice can have any orientation, the tilt is 0 and the point’s z axis is important to give the height at which we want to slice the layer:
const getSlice = height => {
  return new VoxelSlice({
    tilt: 0,
    point: [0, 0, height],
  });
};

Change the vertical exaggeration

In our application we need vertical exaggeration, otherwise we wouldn’t be able to see the variation of the values on the z axis. To change the exaggeration within ArcGIS API for JavaScript we can set it on volumeStyle.exaggeration.
I hope this blog post gave you a few ideas of the voxel layer capabilities on the web. If you used voxel layers or plan to use them I’d be happy to hear about it in the comments below.

About the author

Raluca works as a web cartographer with the Geo Experience Center team at Esri. She loves to play around with web technologies and visualization styles. If she's not in front of the computer, she's probably somewhere up in the mountains.

Connect:
2 Comments
Oldest
Newest
Inline Feedbacks
View all comments

Next Article

Tighten Up Your Edits with Editing Constraints in ArcGIS Online

Read this article