Data Axle business locations are part of a comprehensive portfolio of points of interest (POI) data offered by Esri. Points of interest data from Data Axle focus specifically on business information, containing key details such as industry codes, employee counts, corporate relationships, and estimated sales volumes.

Read on to learn about what’s new in the latest release of Esri’s POI data, as well as best practices for using it in ArcGIS Business Analyst Web App:
- The POI search workflow has been redesigned to include a Results pane that provides quick business intelligence on POI in your area of interest.
- Esri is making some new Data Axle business attributes available to users, including fields indicating business specialty and more granular location information.
- Did you know: You can map businesses and then style them according to their square footage, or other numerical attributes in the data.
- Business Summaries data will now be updated three times a year!
New POI search workflow
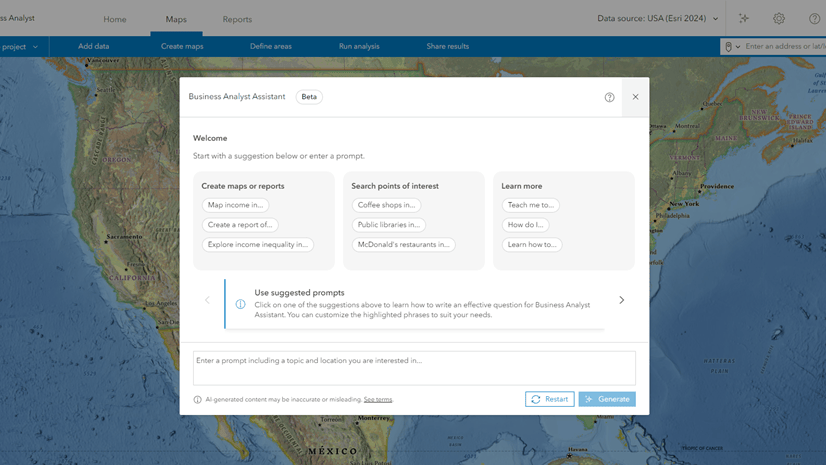
The June 2024 release of Business Analyst Web App includes a redesigned points of interest search. All the familiar functionality is there—searching, filtering, and saving points of interest—with a refreshed look and new features. For example, you can now save your search parameters to use again, set the analysis extent, and interact with the results in new ways.
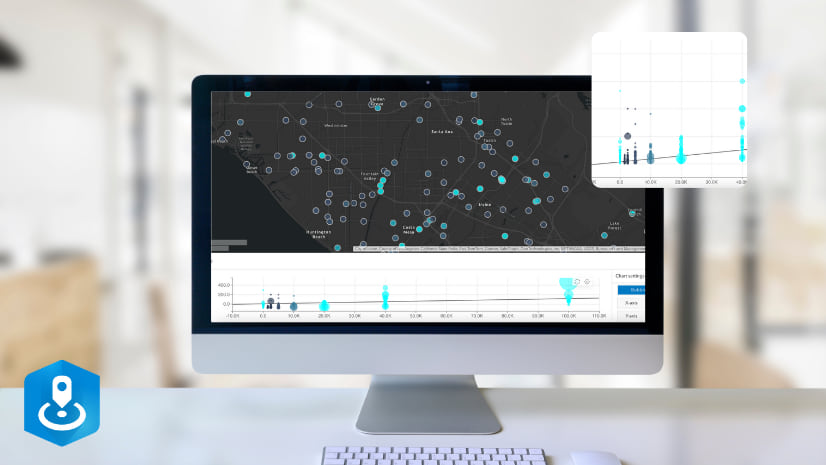
Arguably the biggest innovation in this revamped workflow is the new interactive Results pane that appears when you do a POI search. This pane will feel familiar to users of color-coded maps, smart map search, and suitability analysis. The Results pane has now been customized for POI searches! Once a search is run, you can quickly view statistics on many business attributes. For instance, do you want to know if your area of interest is predominantly independent businesses or chain stores? The pane provides an immediate overview of this information.

There are different views of the pane to help you explore the trends in your data. Would you like to know which business in the map area are outliers in sales volume? Look at the Histogram tab to see.

New attribute fields for greater POI knowledge
New attributes create additional pathways for querying, analyzing, and displaying Business Locations point data. The Specialty field added with this release provides detailed information about business type, restaurant cuisines, religious denominations, specific car makes for car retailers, and more. Whether you’re looking for a Catholic church or a Mercedes dealership, the Specialty field gives you a glimpse into helpful business details.
How might this be used? Here is an example: Say you are interested in opening a new burger restaurant in an area. A search for the word ‘burger’ in the Specialty field shows some potential competitor businesses.

The Specialty information also reveals whether the locations are full-service, limited-service, or offer delivery. This could be valuable to consider when evaluating services that competitors in the area offer.

Note that the former ‘Professional Specialty’ field has been folded into this new, richer Specialty field and is no longer available as a standalone attribute.
The second attribute addition for this release is a field called Location Parent Relationship, which provides information on the relationships between businesses that share a common location. For example, the pharmacy section inside a grocery store might be designated as a department, whereas the coffee shop that is also inside the grocery store but a completely different company would receive the value of separate in this field.
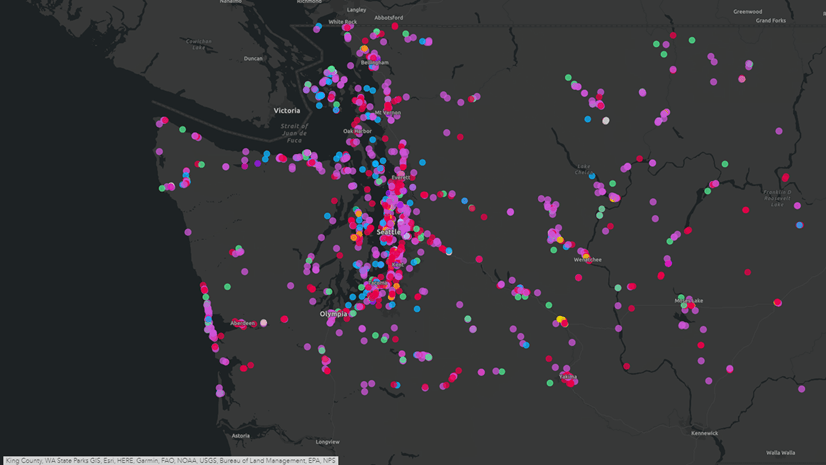
Map by location size
Did you know you can symbolize Business Locations by the building size? This capability was released earlier in 2024, but has flown under the radar a bit. Data Axle provides an approximate square footage estimate for most business locations that can now be used to symbolize business points in your map. If you are interested in identifying the large shopping centers, grocery stores, or warehouse businesses in your area, for example, this could be a useful tool.
In our banner image at the top of the article, sushi restaurants in Southern California are symbolized (using a nifty custom symbol we made) by minimum square footage, and below we are showing the same concept with warehousing and transportation businesses along I-10 around Phoenix.

Business Summaries, now three times per year
Esri Business Summaries aggregate Business Locations from Data Axle for specified North American Industry Classification System (NAICS) and Standard Industrial Classification (SIC) categories. Previously, Business Summaries were only released once a year. Beginning with the June 2024 release, these summaries will be released three times per year, along with the associated Business Locations release.
The Esri Business Summaries provide ready-to-use information by business category for standard geographies (such as ZIP Codes), Uber H3 hexagons, and user-generated custom polygons. There are many business category aggregations to pick from. For each area, the dataset summarizes:
- Number of businesses by industry
- Total sales
- Total number of employees
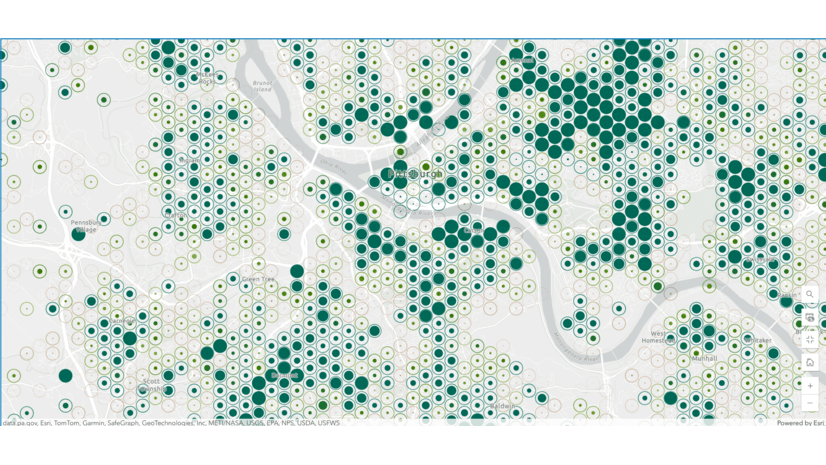
The figure below shows a smart map search using Business Summaries for Wholesale Trade, aggregated to hexagons, as one of the inputs.

Where do I get more information?
We hope this has been a useful update on enhancements to business data in the June 2024 release. Check out the links below for additional information:
- Learn more about Data Axle as a data provider, including data availability, reference documents, and sample reports and infographics.
- Learn more about all the data accessible in Business Analyst and how to work with it.
Happy exploring!


Article Discussion: