It’s release time – woo! We don’t even have words to explain our excitement with this release of ArcGIS Business Analyst Web App, ArcGIS Business Analyst Mobile App, and ArcGIS Community Analyst. In the past quarter, the Business Analyst team has been working around the clock to bring you updates you’ve all been waiting for!
If you’re new here, welcome – we’re glad you’re interested in learning more about Esri’s location-based market intelligence tool. ArcGIS Business Analyst helps you make smarter decisions for market potential planning, site selection, and customer segmentation. You can identify under-performing markets, pinpoint the right growth sites, locate your target audience, and share the market research across your organization. If you’d like to learn more or want to try ArcGIS Business Analyst Web App, sign up for a free 21-day trial.
The June 2024 release includes a ton of new features and enhancements, which are listed below. Make sure to read on to get all the important details on how you can use all these new features in your daily mapping analysis.
- Introducing Business Analyst Assistant (Beta)
- Redesigned points of interest search workflow
- Suitability analysis workflow enhancements
- Reorganized app header
- New data browser experience
- New gallery infographics and classic report enhancements
- Import attributes from other projects
- ArcGIS Business Analyst Mobile App updates
- ArcGIS Experience Builder: Business Analyst widget new features & enhancements
- Major data updates
- ArcGIS Community Analyst deprecation
Introducing Business Analyst Assistant (Beta)
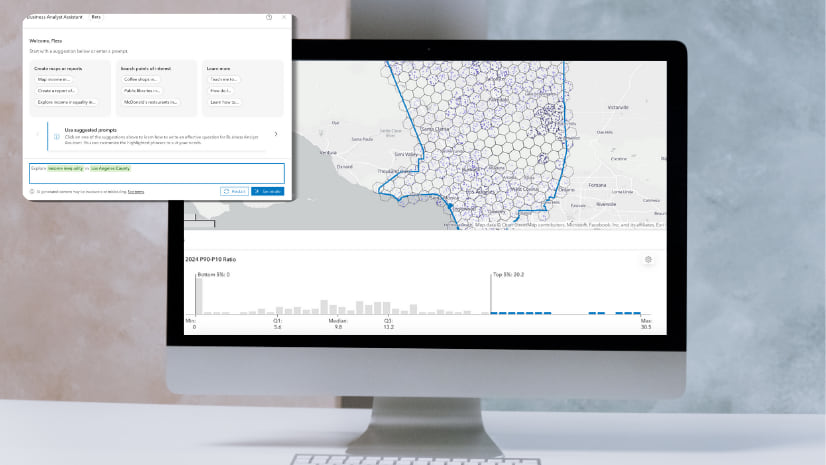
As you may know, technology is evolving every single day, especially with advancements in artificial intelligence (AI). With that, we are happy to announce the beta launch of Business Analyst Assistant, our new in-app AI-powered productivity tool. This tool will guide you through your workflows by providing intelligent suggestions, responding to prompts and search queries, and guiding you through the app using tips and resources. There’s a LOT this valuable tool can help you with: create color-coded maps, find points of interest, run infographics, understand your needs through natural language prompts, provide suggestions that can be executed through workflows, allow you to customize suggestions to better suit your needs, assist with in-app interactive guided tours, and answer tech support and product documentation questions.
To make things even better, your organization has full control of this tool. Your organization’s administrator can enable or disable Business Analyst Assistant (Beta) for all member of the organization by clicking My Preferences > Organization > Assistant.
Note: This is only available for ArcGIS Business Analyst Web App users and must be enabled to use it. Please keep in mind, Business Analyst Assistant is a beta feature that is continuing to be developed.
Redesigned points of interest search workflow
The Business Analyst team is always making updates to workflows to ensure you get the best analysis out of each tool. With this release, we have made some major improvements to the points of interest (POI) search workflow. POI search provides information about specific locations such as businesses, government buildings, landmarks, tourist attractions, and more. With points of interest search, you can identify key businesses and community locations, plan for future expansion, identify market gaps, and perform competitive analysis.
If you don’t remember, the first phase of updates to the POI search were in the February 2024 release. These updates allowed you to easily refine your search for better results. Now we’re back, with phase two with even bigger enhancements. With this release, you can still search POIs by keywords, categories, or codes. Now, once you’re done, if you’d like to save your search for use in future sessions, simply use our new ‘Save search’ option to do just that. That’s not all: similar to the design style of the color-coded maps, suitability analysis, and smart map search workflows, we’ve added the interactive results pane you all love to this workflow as well. Get ready to now explore results through interactive data summaries, visualizations, and tables. Simply hover over a bar in the histogram or a cell in the table to better interpret your results.
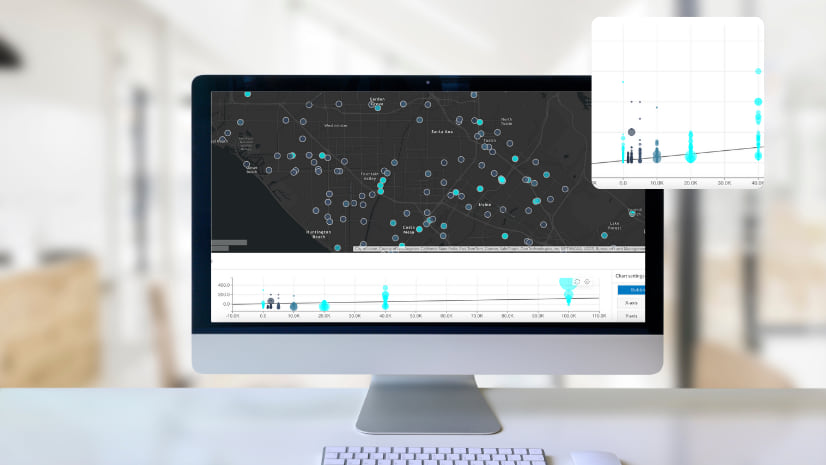
Suitability analysis workflow enhancements
I am always excited to share the latest updates of suitability analysis, since it is one of my favorite workflows in Business Analyst Web App. With suitability analysis, you can take your analysis skills to the next level as it helps you rank and score numerous sites that meet your specific criteria. Now when you use this workflow, you will notice we have improved the interaction between the results table and the map to better highlight your analysis. Simply hover over the bubble chart or scatterplot to highlight that area on the map, which will make your area stand out from the other areas that are faded into the background. We’ve even added new chart controls, a new zoom feature for bubble charts and scatterplots, as well as an improved site pop–up that displays additional details in your analysis.
Reorganized app header

We love making meaningful updates that will improve your overall user experience. Once you log in to Business Analyst Web App, you will notice we have updated the top header with a much-improved order and a brand-new action bar. Please do not be alarmed by all these changes since everything will be easier to access and discoverable, you will be able to put all your focus on your mapping journey. Some of the changes include:
- A new action bar has been added to easily launch Business Analyst Assistant (Beta), open the Preferences, and view the Help and resources section. (Business Analyst Assistant only available in Business Analyst, not Community Analyst)
- The country flag is removed and replaced with the Data source followed by the selected country name.
- Guided tours have been moved under Help and resources for easier access.
- The Autosave button is moved to My Preferences > General > Settings and is turned on by default.
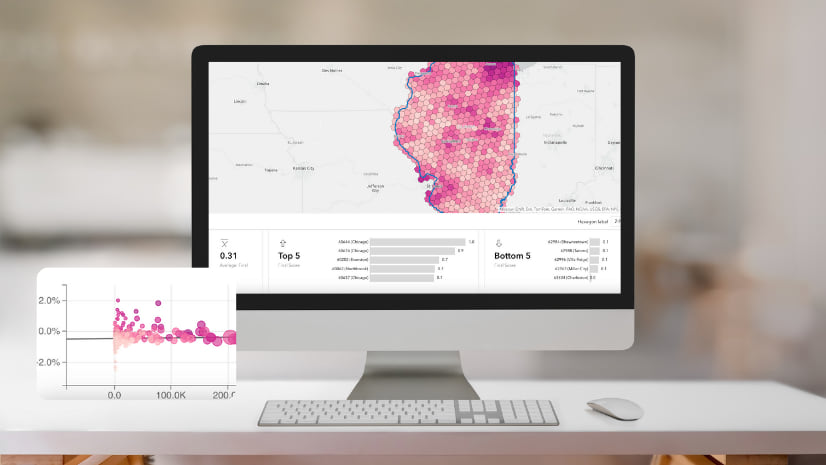
New data browser experience

What makes Business Analyst extremely powerful is the data! Don’t worry, we will talk about all the new data we have added with this release later but right now, we wanted to highlight the redesigned data browser that brings a new look and more ways to make the most out of the data. Once you open the redesigned data browser, you will see a simplified vertical navigation bar. With this new bar, your life is about to become much easier since you can now easily switch between categories without the need to navigate back and forth from the main page. We’ve also added a new “popular” category that has all the popular variables in one area, as well as a “new and noteworthy” category that highlights all the new variables.
We wanted to take it a step further by also enhancing the search capabilities with advanced filtering, the flexibility to browse by year, dataset, or source as well as the ability to segment variables by standard variables (variables included in Business Analyst), my variables (data you have imported or used in custom data setup), and shared variables (variables shared with others in your organization).
New gallery infographics and classic report enhancements
We are constantly updating our infographics and reports to bring you the latest and most up-to-date ones. We have made significant enhancements to our infographics and reports that I’ve broken down below.
Infographic enhancements:
We all love infographics, and why wouldn’t we? You can visualize all the key information in the form of eye-catching graphics, charts, tables, images, and text. Below are our newest infographic additions to the infographic gallery.
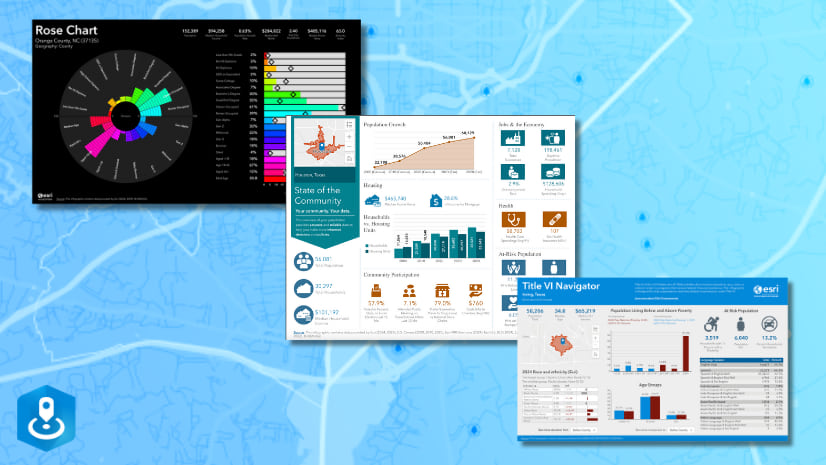
New: State of the Community infographic
We are excited to share our latest addition to the infographic gallery: the State of the Community infographic. This infographic was created by one of our own Esri team members, Shannon Valdizon. This infographic was inspired by her conversations with elected officials and government leaders highlighting data about population, housing, jobs, health, community participation, and other valuable information to make informed policy decisions.
New: Rose Chart infographic
This colorful, eye-catching infographic highlights a wheel and bar chart that display key demographic indicators for an area, such as age, education level, population, income, net worth, and home value, and ownership
New: Title VI Navigator
This infographic can help organizations assess their compliance with Title VI of the Civil Rights Act of 1964 by displaying information on population, age, race, ethnicity, poverty, language, and at-risk populations.
Classic report enhancements:
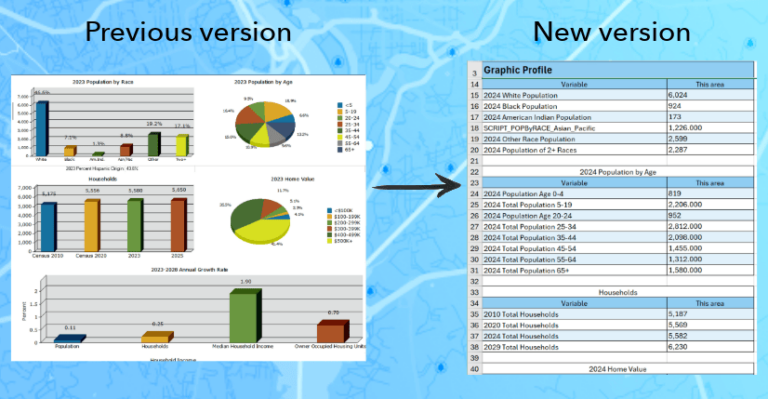
Are you ready to explore and interact with your reports? We are excited to let you know that you can export classic report content to Excel to gain an even better analysis and more control. Previously, reports would be populated as images when exporting to Excel, well no more! Now, when you export to Excel, you can explore the data for further calculation, analysis, and comparison.
Import attributes from other projects
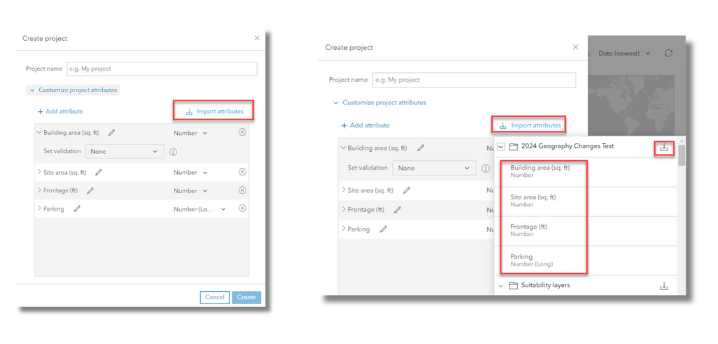
The Business Analyst team has been on a roll with this release, ensuring your Business Analyst journey is smoother than ever. I’m sure in the past, you may have worked on multiple projects and then realized you wanted to use the same custom attributes in a new project, but you just simply couldn’t copy them over. You can now import attributes from other projects when you create a new project – woo! We’ve made it as simple as one, two, three – all you have to do is click the ‘Import attributes’ option and select the project that includes the attributes you would like to use in your new project.
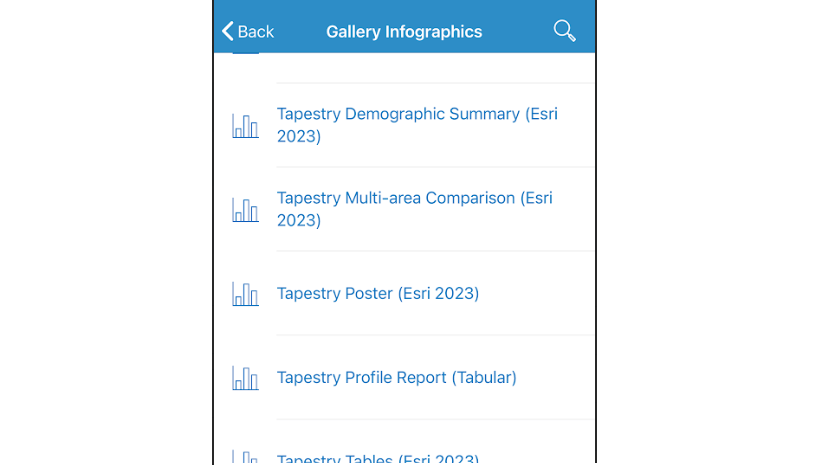
ArcGIS Business Analyst Mobile App updates
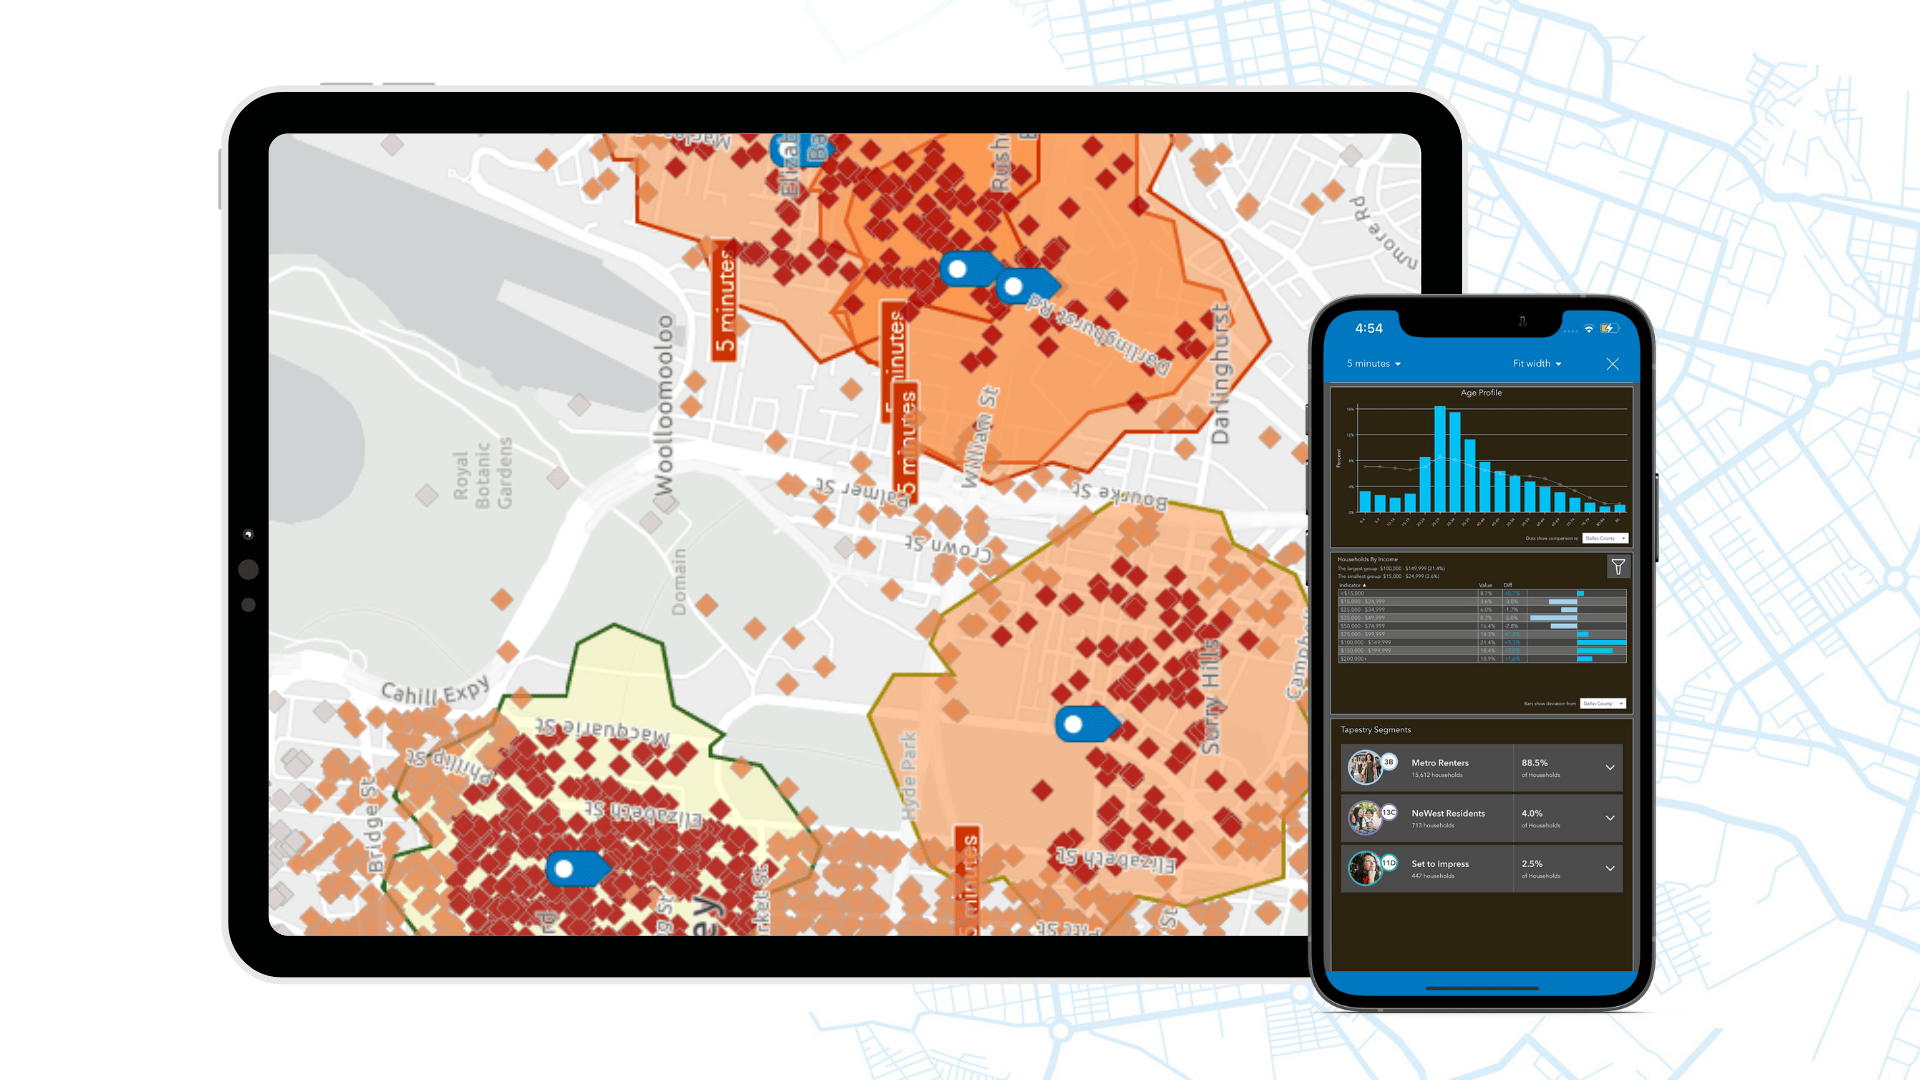
Are you on the go or in the field and want to use ArcGIS Business Analyst? All you have to do is download the ArcGIS Business Analyst mobile app from the App Store or Google Play. We’ve made some exciting new changes to our mobile app. You can now run infographics using the Gallery infographics exactly how you can in the Business Analyst Web App and the Experience Builder Business Analyst widget – wow! Additionally, gain access to the latest 2024 data updates on the mobile app today.
Learn all about the Business Analyst Mobile App updates here.
ArcGIS Experience Builder: Business Analyst widget new features & enhancements
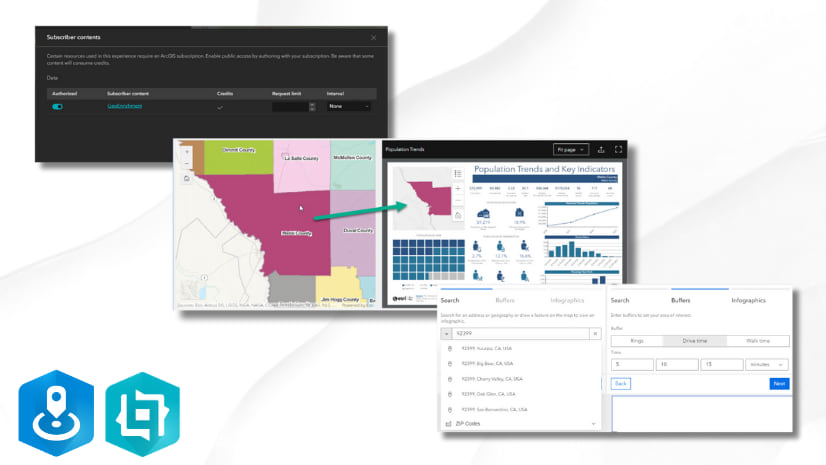
The Business Analyst widget in ArcGIS Experience Builder is a popular and well-loved tool that provides users with the ability to view additional information about any point or polygon feature on a map through the creation of reports and infographics. Check out some of our new enhancements:
Public sharing across Experience Builder apps:
We’ve heard all your requests, and we are excited to announce that the Business Analyst widget can now be used in a publicly shared Experience Builder apps.
Support for polygon feature map styles:
You can now preserve polygon features in a web map when running infographics by selecting those feature.
A refreshed new user interface look:
We have redesigned the search and buffer steps of the workflow mode to improve the overall user experience.
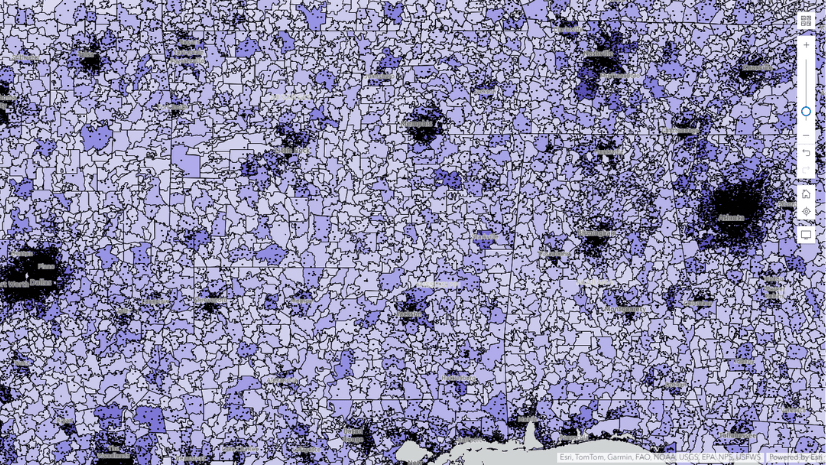
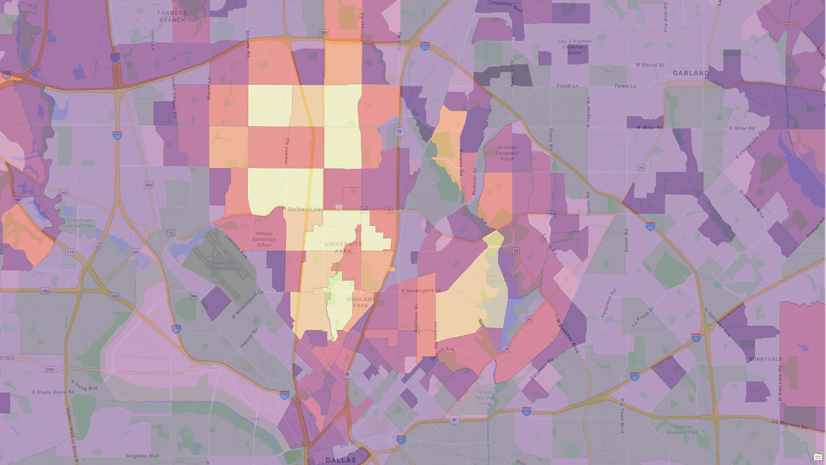
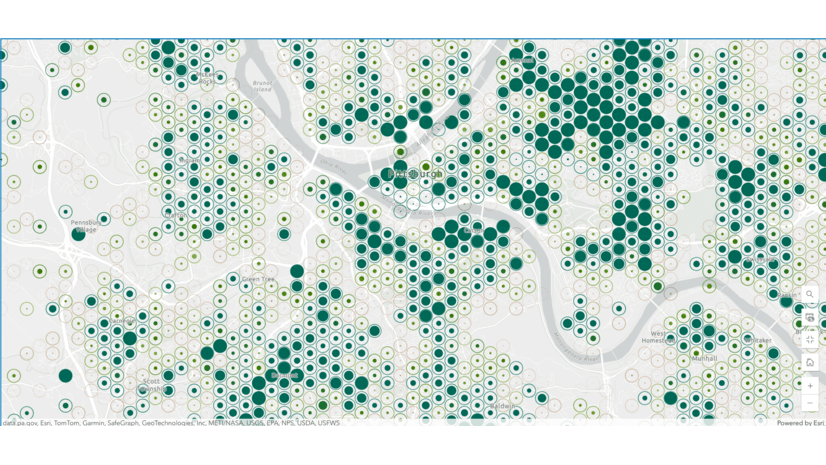
Major data updates:
One of our greatest strengths is the data that comes with ArcGIS Business Analyst. There’s so much you can uncover with this data, and on top of that, you can combine it with your own data to advance your analysis. With our June release, we are happy to announce the biggest data update of this year. Below we’ve broken down all the updates and changes we have made.
Data Updates (US):
- Updated Esri Demographics data (2024/2029)
- Updated Esri Consumer Spending data (2024/2029)
- Updated Esri Market Potential data (2024)
- Updated Retail Demand by Industry (2024)
- Updated Esri Tapestry Segmentation (2024)
- Updated American Community Survey (ACS) data for the US (2018-2022)
- Updated USA Traffic Counts data from Kalibrate (Q2 2024)
- Updated Business Summary data from Data Axle for the US (Feb 2024)
- Updated Points of Interests: Data Axle (Q1 2024), Safegraph (Q1 2024)
Data Updates (Global):
- Updated American Community Survey (ACS) data for Puerto Rico (2018-2022)
- Updated Census 2000 and 2010 data for Puerto Rico (aligned with the US)
- Updated Crime Indexes from AGS 2024A
- Updated Standard Demographics from Michael Bauer Research for 25 Eastern European countries (2023).
- Updated premium data: Esri India POI (2024), Esri Japan, and redelivery of Esri France data.
- Updated global POI data from Foursquare (Q1 2024)
Important Geography Data Changes: New and Updated Boundaries
The below geography boundary changes impact maps, reports and analysis.
- New Esri 2023, and Esri 2024 ZIP Code boundaries for USA and Puerto Rico (TomTom-based boundaries).
- New Connecticut coding structures – Connecticut has worked with the Census Bureau to better align their counties to their regional planning entities. All Connecticut counties and all tracts within the new counties have a new FIPS code.
- Updated CBSAs (Core Based Statistical Areas) delineations.
Please note: if you previously saved sites or reports using the above geography changes, they will need to be updated with the new boundaries
To find out more, take a look at Updated U.S. geographic boundaries in ArcGIS Business Analyst (June 2024).
Data Deprecations:
- The Esri 2021 and Esri 2022 data sources have been deprecated in the June release. Learn more about the deprecation here.
- Netherlands data (4orange) will be deprecated in October 2024.
ArcGIS Community Analyst Deprecation
ArcGIS Community Analyst is being deprecated entirely. The June 2024 release is the second to the last release for this product, with the final release in October 2024. Community Analyst will remain accessible to users until their next annual renewal date after December 1, 2024.
For additional details, refer to Deprecation Notice for ArcGIS Community Analyst: Transition to ArcGIS Business Analyst Web App.
Additional resources
We’re so happy to share the latest 2024 release updates of ArcGIS Business Analyst Web App with you! Below, we’ve added resources to help you with your ArcGIS Business Analyst journey:
- Business Analyst product overview page
- Review pricing and purchase Business Analyst
- Join our LinkedIn Business Analyst User Group
- Join our Business Analyst Esri Community
- Follow our weekly #BATipsandTricks posts on social media
- Read more Business Analyst blog articles on ArcGIS Blog
- Watch Business Analyst Web App videos
- Watch Business Analyst Mobile App videos
- Visit the Business Analyst Resources page
- Visit the Community Analyst Resources page

Article Discussion: