Data science is the study of data to extract meaningful insight and inform decisions. In ArcGIS Pro 3.1, we have extended our data science capabilities by supporting a new trajectory data type for working with satellite altimetry sensors and we continue to develop algorithms for image analysis and processing.
A new trajectory dataset
Satellite altimetry is a growing field that measures the elevation or height of the earth’s surface at discrete points along the satellite’s path. Satellite altimetry data is especially useful in advancing our knowledge of ocean, ice sheet topography, and global climate.
The data are collected as sequential points along the sensor’s path and stored in netCDF and HDF formats using a trajectory data structure. Each file contains the measurements for a single track or pass over the Earth’s surface. Below is an example of sea wave height along one track.

Data for even a small region can be composed of dozens of individual files. To simplify the management and processing of this type of data, we have developed a new trajectory dataset and three new geoprocessing tools that allow you to work with trajectory data acquired by the Sentinel-3, Sentinel-6, ICESat-2, and CryoSat-2 sensors. The graphic below contains a global trajectory dataset (left), with a zoomed in view of the footprint and point sublayers (upper right). The three tools used to create trajectory datasets are also included.

A trajectory dataset manages a collection of trajectory files as tables in a geodatabase. It contains a footprint sublayer that displays the trajectory of each file and a point sublayer that displays the location of each measurement. The trajectory dataset does not store the data points but references the original dataset. This avoids data duplication and allows you to visualize and explore the trajectory data. You can also create a trajectory layer from a single trajectory file using the new Make Trajectory Layer tool.
New Interpolate From Spatiotemporal Points tool
While the trajectory dataset simplifies management and visualization of altimetry files, the point data must often be interpolated prior to analysis. The new Interpolate From Spatiotemporal Points tool in the Image Analyst interpolates the altimetry point data into a new raster.

Interpolation methods include triangulation, natural neighbor, inverse distance weighted and nearest neighbor, as well as quadratic and mean, which are often used by the scientific community for this type of data. Unlike other interpolation tools in ArcGIS, this one is time-aware, which means you must specify a time field and a temporal aggregation period for the data. The tool will use the time information to perform interpolation on the points in daily, weekly, monthly, quarterly or yearly intervals. The output is a multidimensional raster that includes a slice for each time interval contained in the input time range. This produces an analysis-ready raster with consistent temporal and spatial resolution. The tool supports input of a trajectory dataset or a point feature class that contains a variable (measurement) field and a time field. The figure below is the monthly Greenland Ice Sheet elevation created from a trajectory dataset containing 4000 tracks of CryoSat-2 data for 2021
Geometric Median raster function
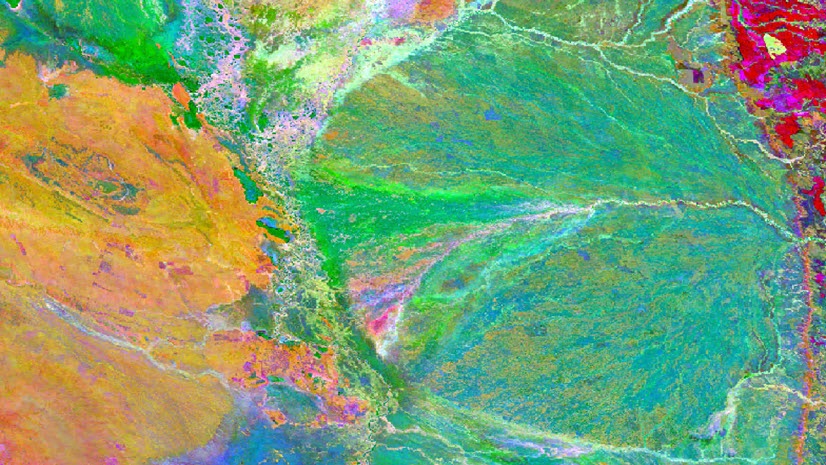
Clouds and shadow are often present in optical satellite imagery, making it difficult to create a cloud-free image composite from multiple scenes. The new Geometric Median raster function allows you to minimize the effects of clouds and shadow in your analysis workflows.

This function takes a mosaic dataset, a multidimensional raster, or a list of images as an input and calculates a “best” pixel by minimizing the distance to all of the overlapping pixels in spectral space. It reduces the contribution of outlier pixels while preserving the spectral relationship between bands. Below is an image composite of the Big Island of Hawaii created using the Geometric Median function along with the Landsat QA band to mask clouds and shadow. The final image composite was created from 145 Landsat ARD tiles for 2021.

Spectral Classification
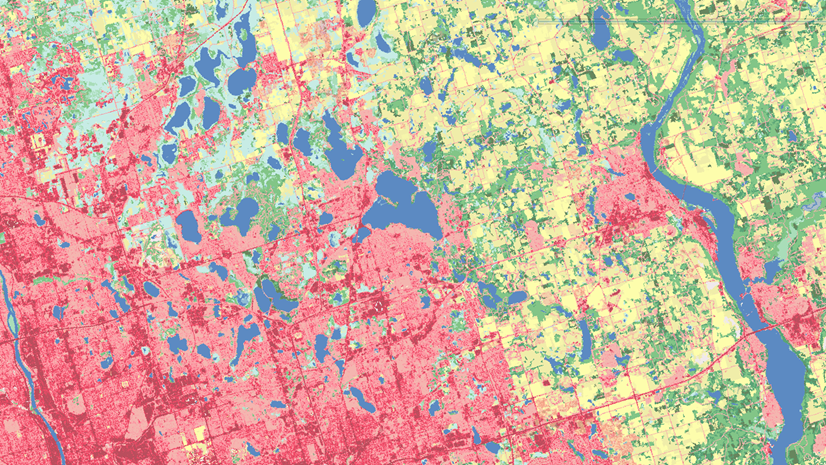
Many image classification methods rely on the statistical and spatial traits of a dataset, where bands are treated as independent variables. The new Classify Raster Using Spectra tool allows you to classify multiband raster data using spectral matching techniques.

The reference spectral information for each class can be provided as a point feature class generated from the Training Samples Manager or a .json file that contains the class spectral profiles. This tool extends options for image classification and compliments the spectral change detection methods available in the Change Detection Wizard. The figure below displays results for spectral classification of corn and soybean crops in Landsat 9 imagery. Results are compared to the USA Cropland image service layer for the same month in 2018.

ArcPy API enhancements
Several enhancements and new functions were added to the ArcPy Image Analysis module:
- The reduce, addField, groupBy and merge methods were added to the RasterCollection. Reduce allows you to apply statistical functions, like min or mean to composite all raster items in the RasterCollection into a single image. addField allows you to add custom information to the RasterCollection attributes. groupBy allows you to divide the items in the RasterCollection into groups and process by group. merge allows you to merge multiple RasterCollections into a single RasterCollection.
- A new suite of functions allows you to compute statistical values for a list of input rasters. For example, StdDev creates a raster object where each pixel contains the standard deviation value across multiple rasters.
- A new functions property was added to the Raster class, which allows you to set processing templates for CRFs.
- computeHistograms, computeStatistics, and isConstant methods were also added to the Raster These methods allow you to compute the histogram/statistics of a raster given an area of interest or in the case of multidimensional rasters, calculate the statistics for a specific variable.
Enhancements to existing functionality
Some major enhancements have also been added to help with analysis workflows, including:
The Training Sample Manager has been enhanced to support collection of point training data, which can be used as input for the Classify Raster Using Spectra tool.
The raster attribute table requirement has been removed for the Summarize Categorical Raster tool. If no table exists, the tool will calculate unique values and the pixel counts for each value.
Date type is now supported as a property of a raster dataset. Some workflows, such as change detection, output raster datasets in which the pixels contain date values. This property allows the renderer or identify function to return values in a date format.


Article Discussion: