A new mapping theme has been included in the June 2024 update of Map Viewer called Reference Size maps. We got excited about them because they can really improve the legibility of Counts and Amounts (size) maps, which are very popular, especially if those maps depict gridded or binned point data. Like all Counts and Amounts (size) maps—also known as proportional symbol maps—the larger the symbol the larger the data value.
With this new variation the secret sauce is the addition of a new fixed-sized outer ring that makes judging relative sizes easier. When paired with the right kind of data, we think they have a pleasing space-filling look that can reveal a lot of subtle patterns and communicate a lot of detail at a glance.
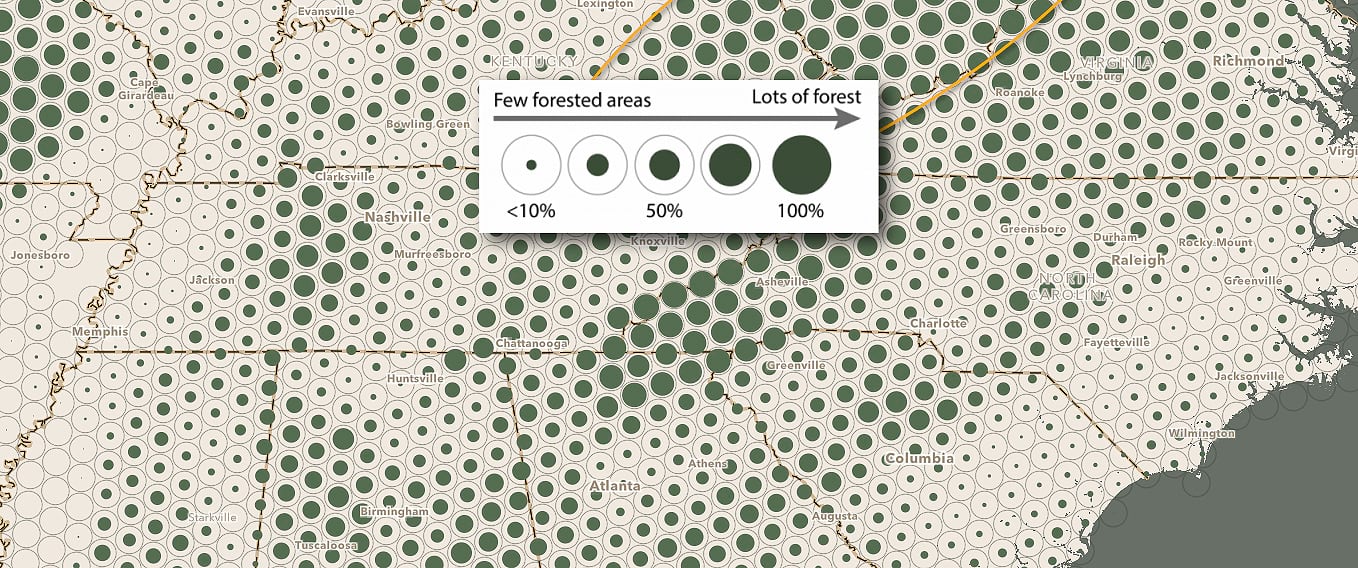
The addition of that outer ring to every one of the scaled map symbols helps because map readers only need to judge what percent of the larger out ring is filled by the inner solid circle. This outer ring is the largest data value in the dataset and it becomes a fixed benchmark for judging sizes. Decades of research has revealed how most of us struggle to accurately judge the size of scaled map symbols (due to the Ebbinghaus illusion and other factors) so every little bit here helps.
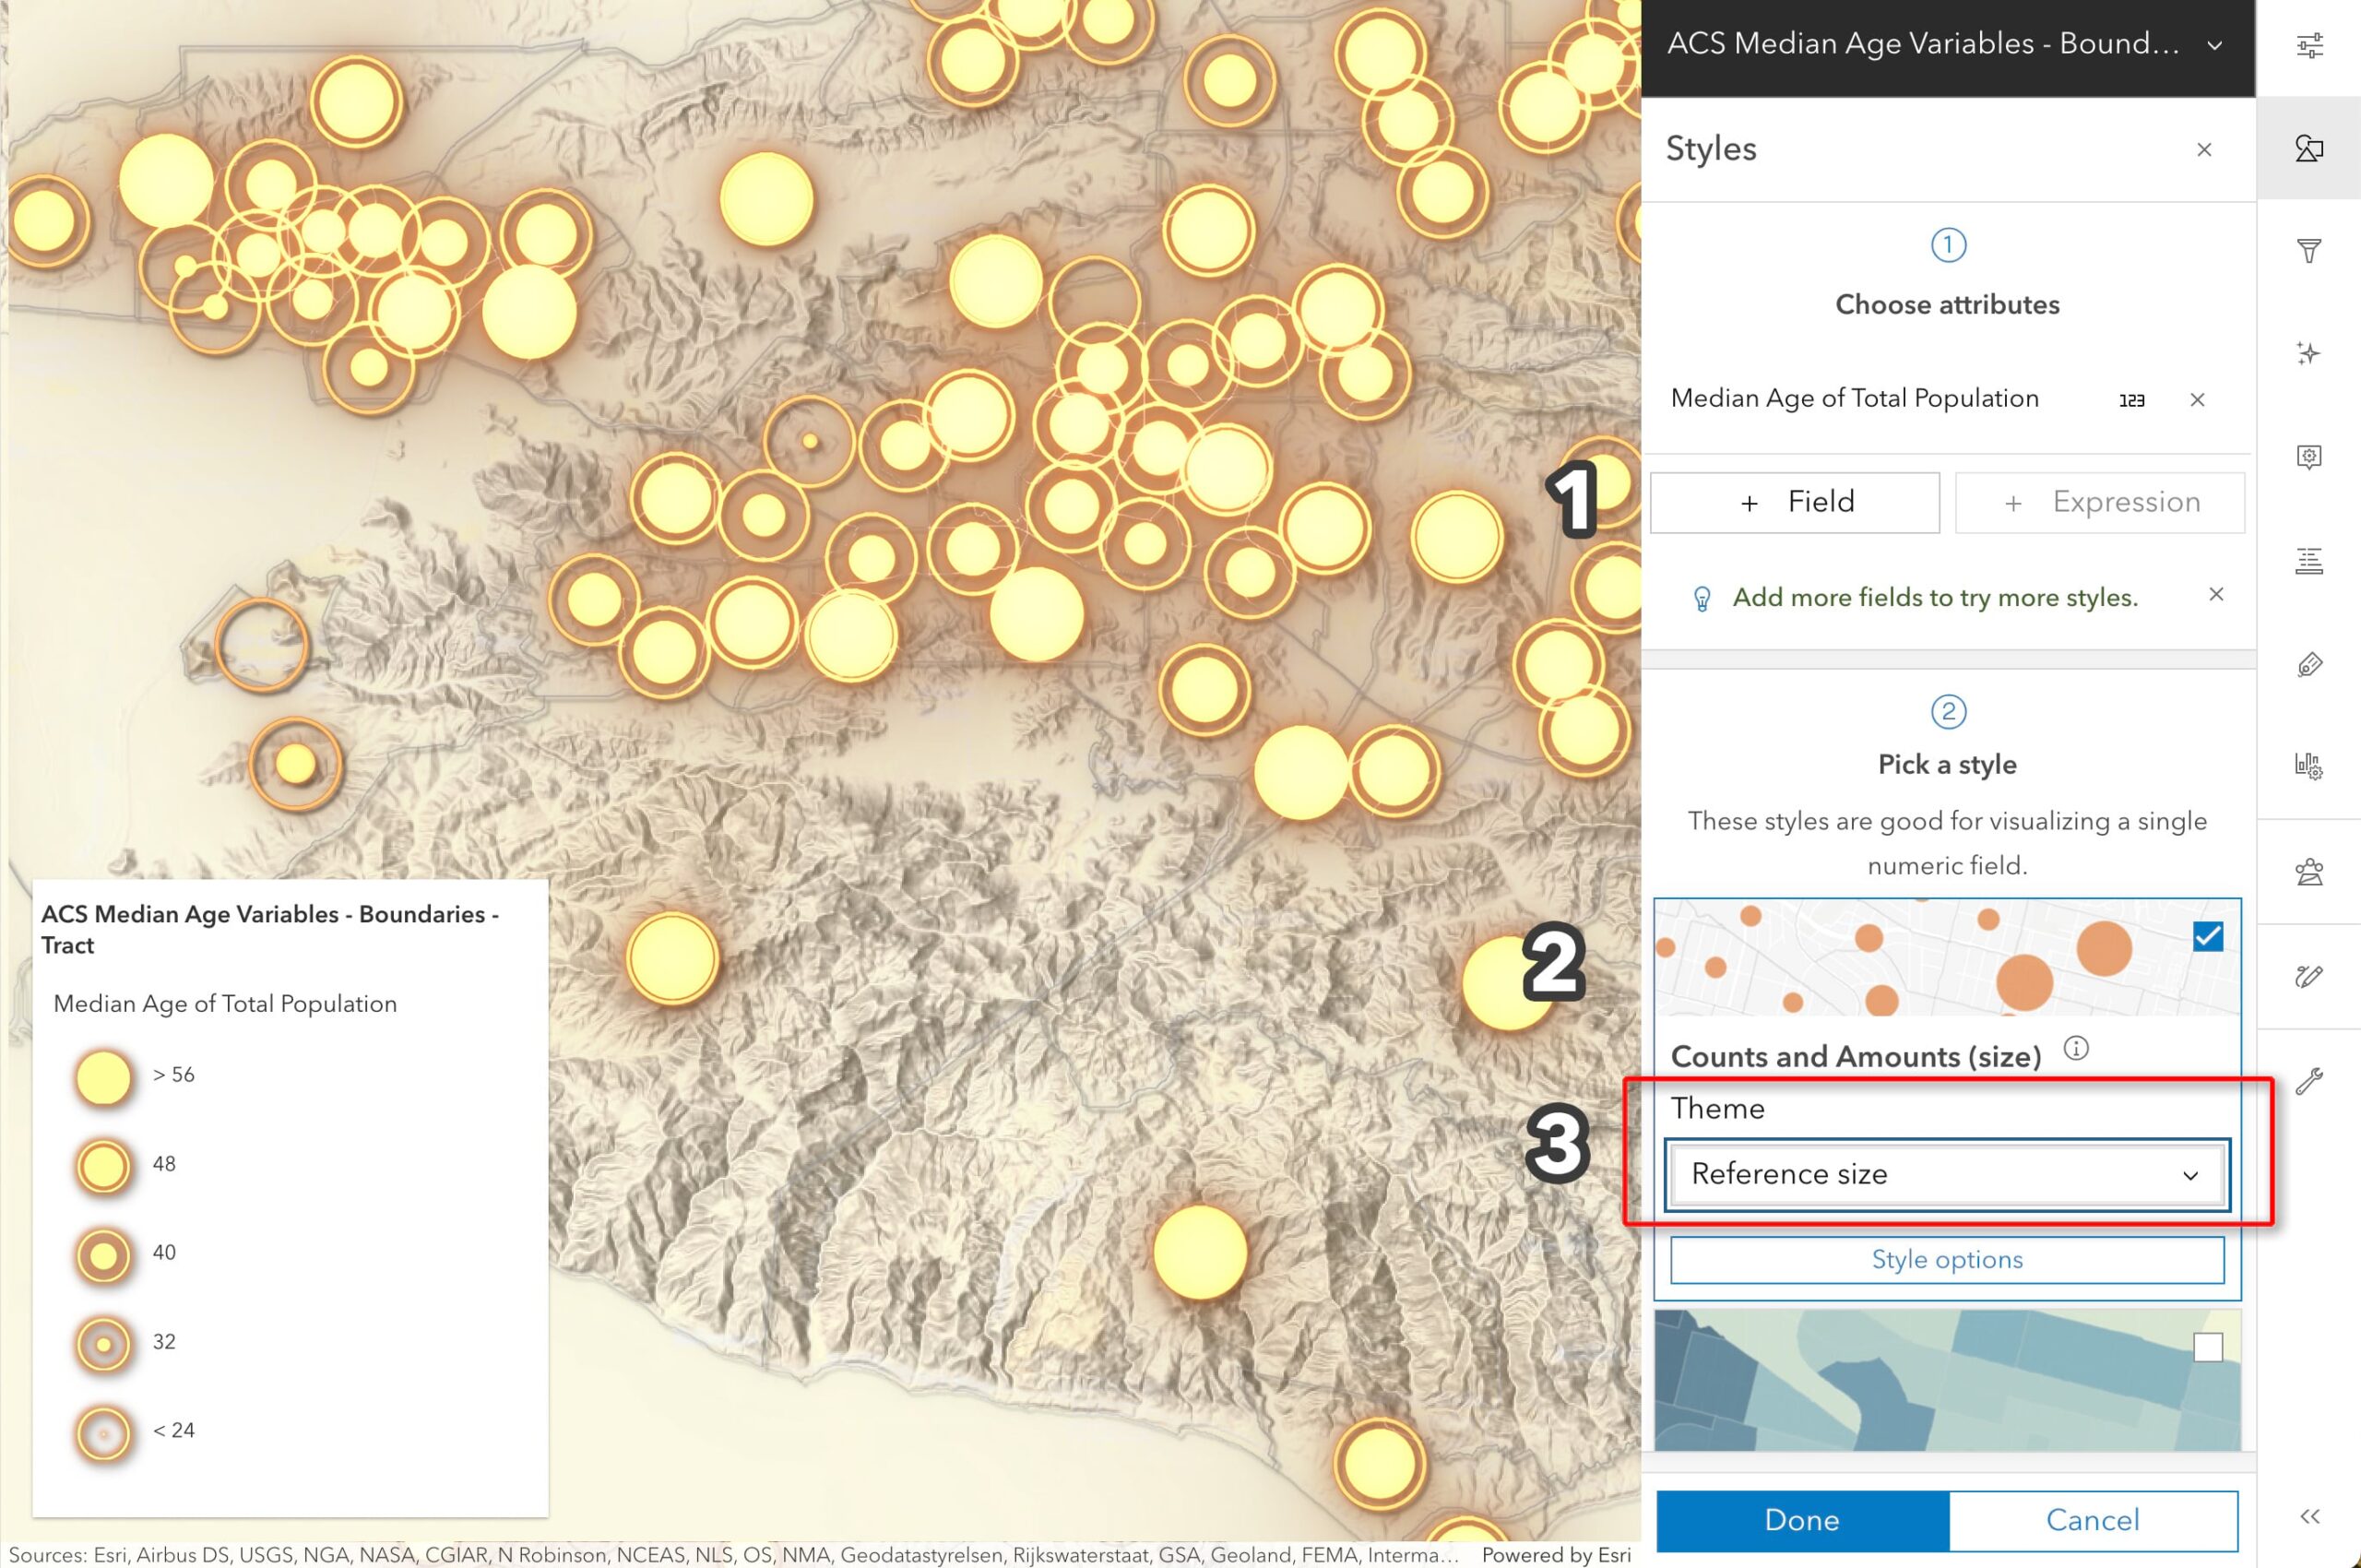
In Map Viewer you can find Reference Size maps as a new theme in the Theme pulldown menu for Counts and Amounts (size). This new Theme will work for binned point features, polygon features, or gridded/aggregated datasets that depict numeric data, such as life expectancy or household income.
- Select a numeric attribute in the Styles panel, here I’ve selected Median Age
- Select Counts and Amounts (size) style
- Pick Reference size in the Theme menu.
- To refine the sizes and styling, click Style option.

At the end of the day, this is a way to enhance size maps; all of the same UI you’ve used before is there, but now you can add that outer reference ring if you think it helps clarify your data. While they are new to ArcGIS, Reference Size maps date back to 1960s pre-digital cartography with both Saul Wurman and Jacques Bertin creating beautiful examples by hand. Because they were very labor-intensive, they never quite caught on as a common map style, but now that you can make them in a single click there is no need to shy away from them.
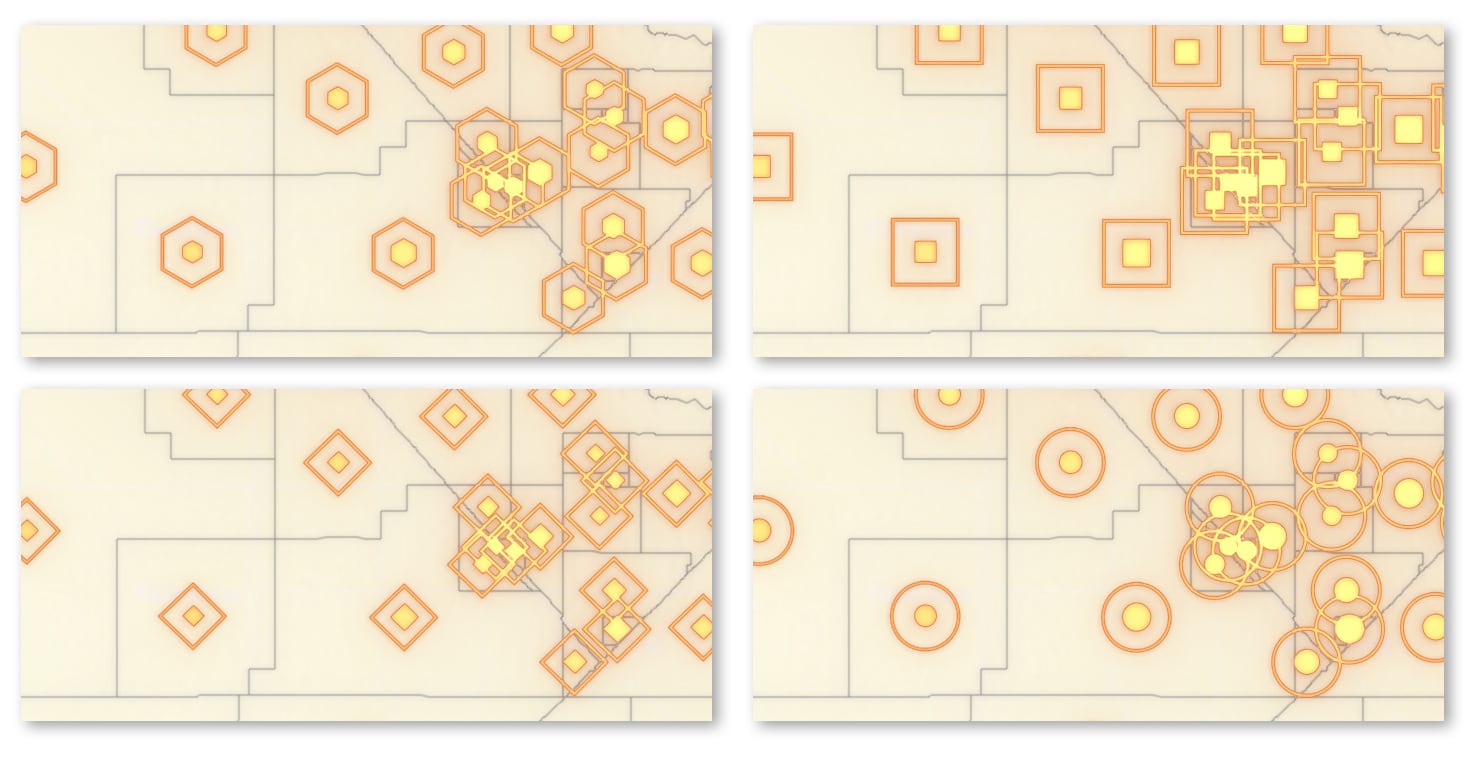
Why stick with just circles! We offer hexagons, diamonds, circles and squares. All of these options are found in the Styling options pane.
Geographic binning makes these maps really shine

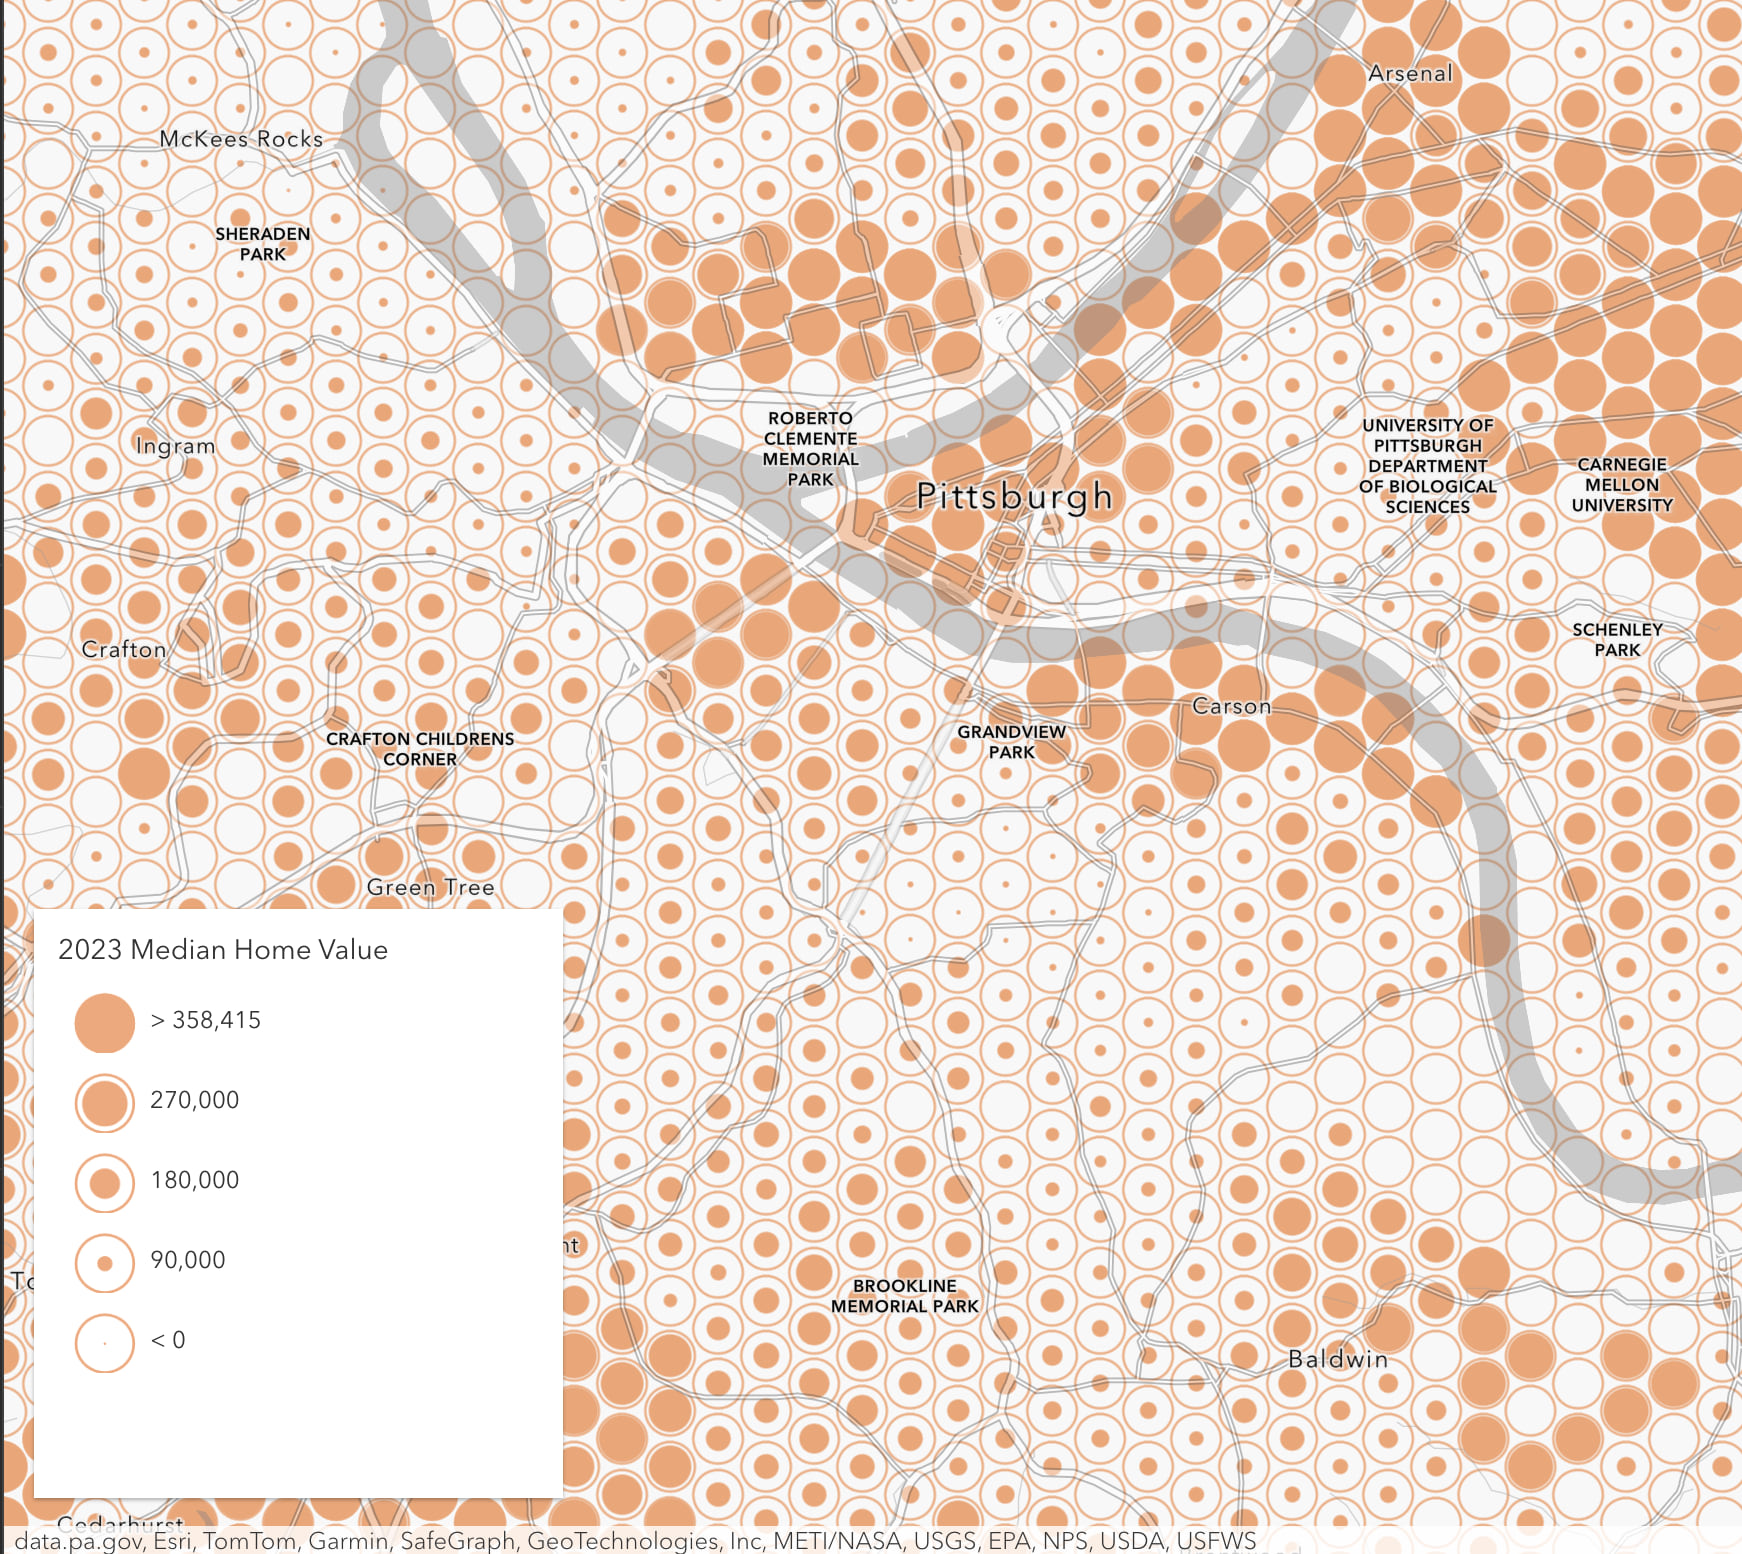
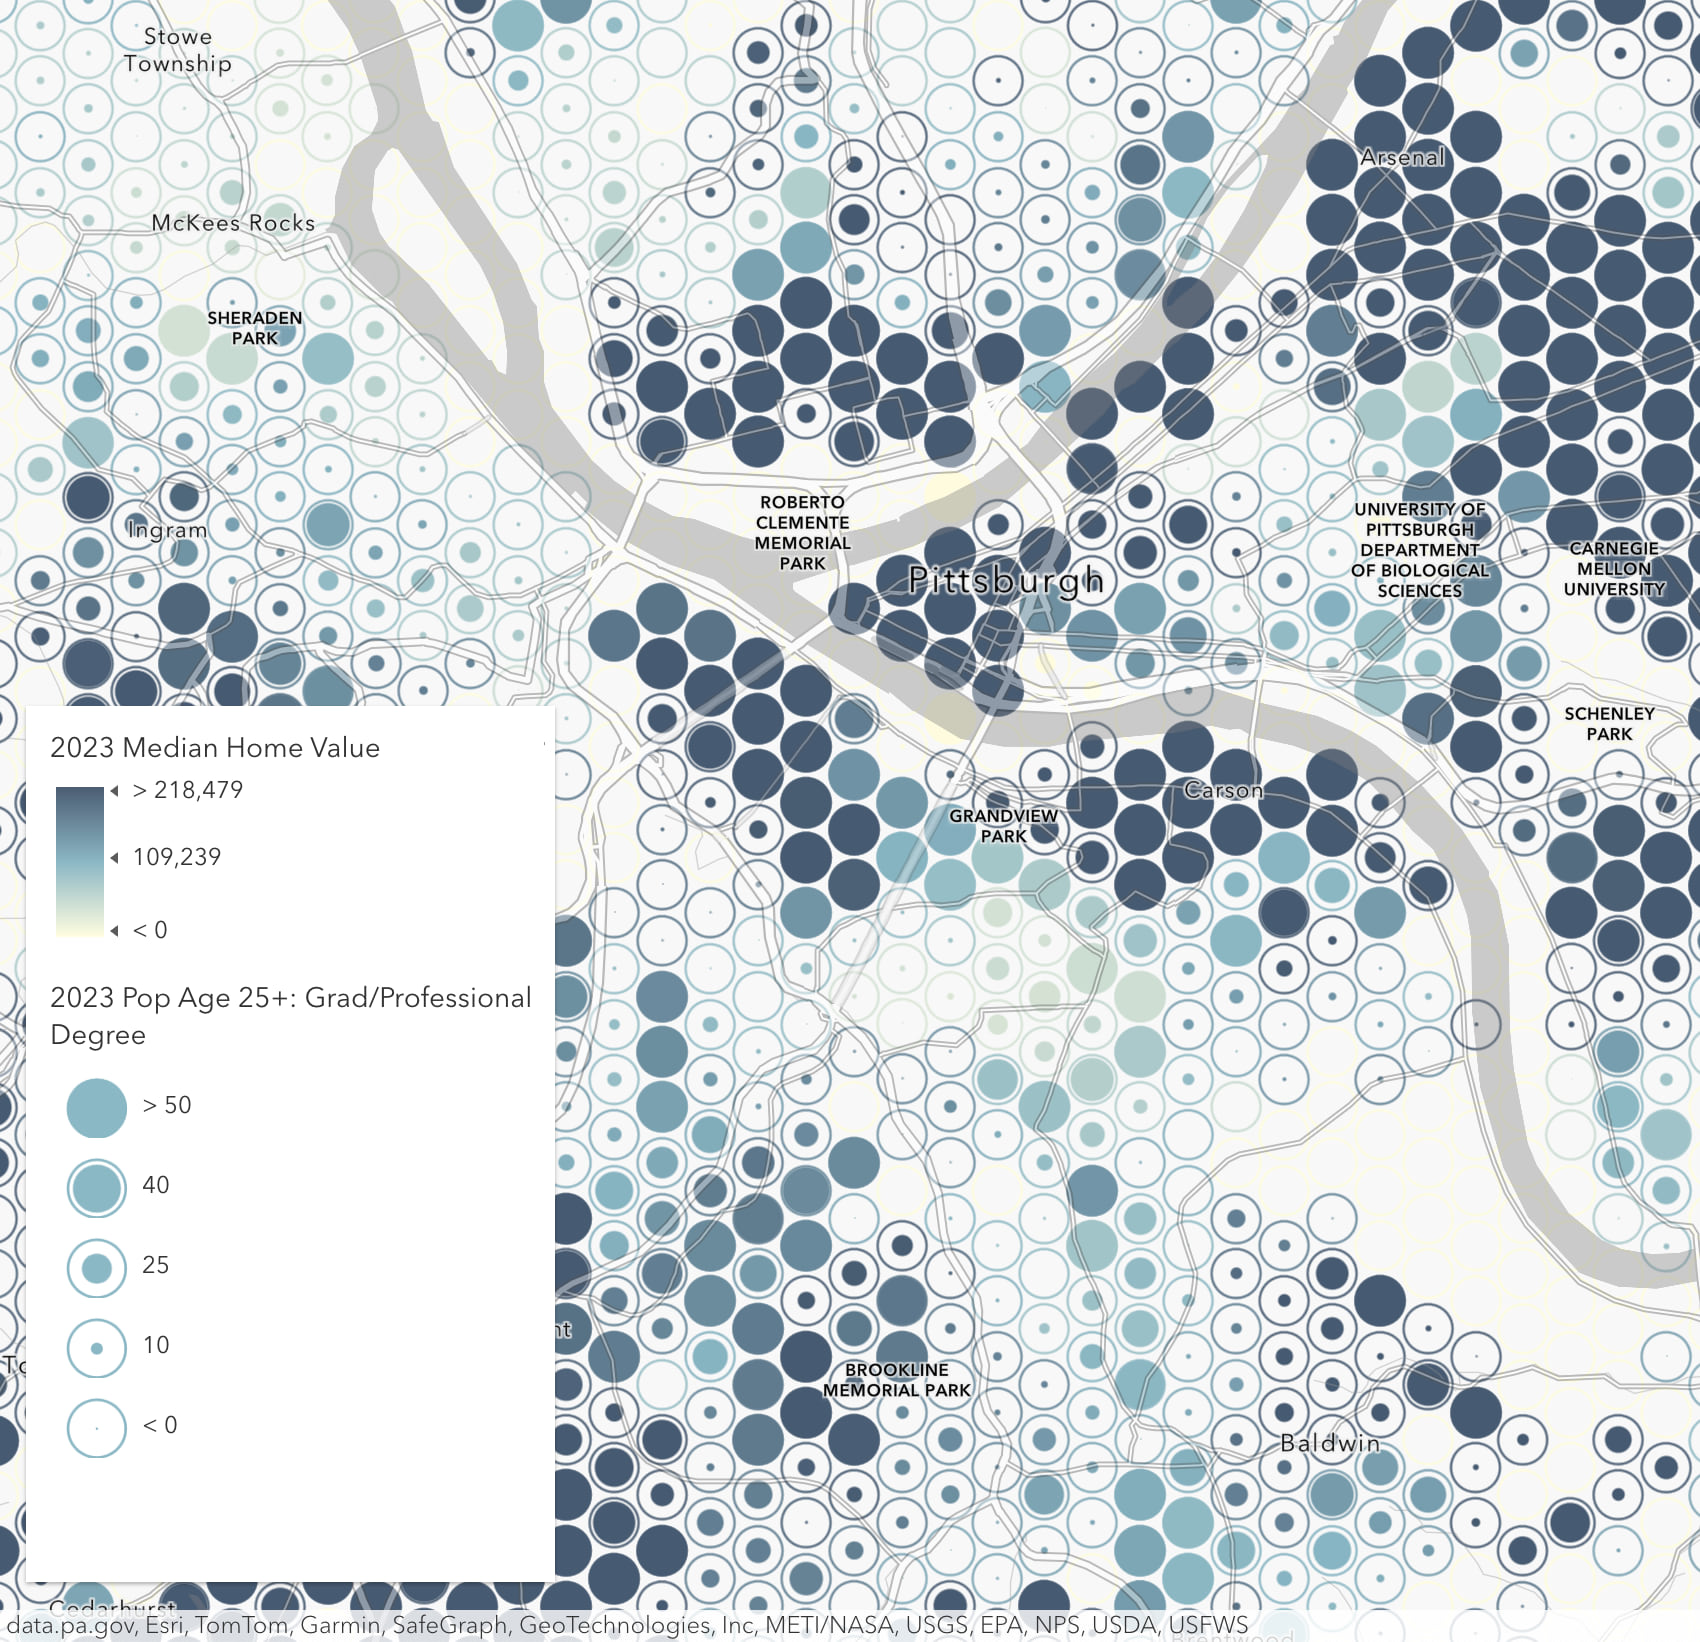
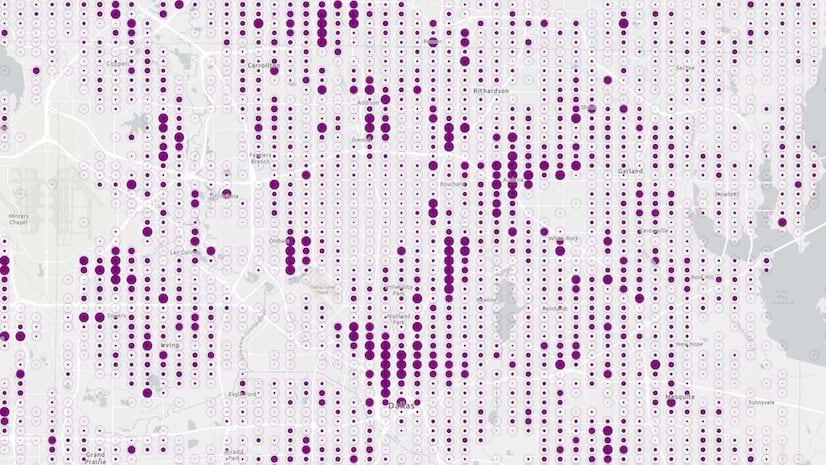
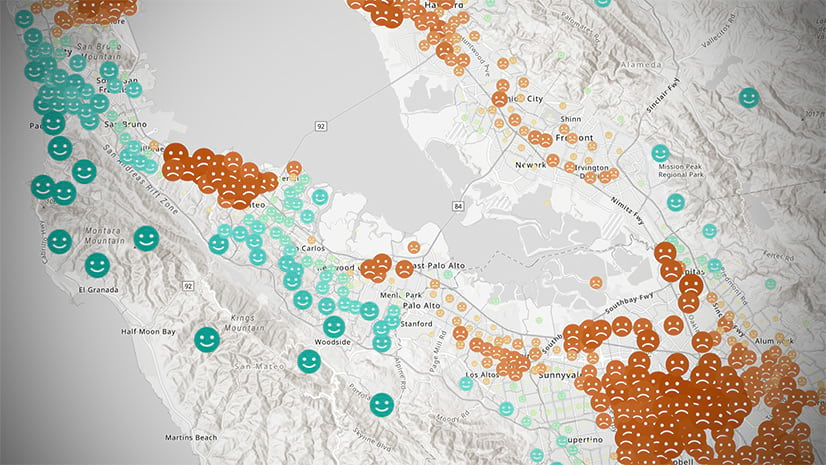
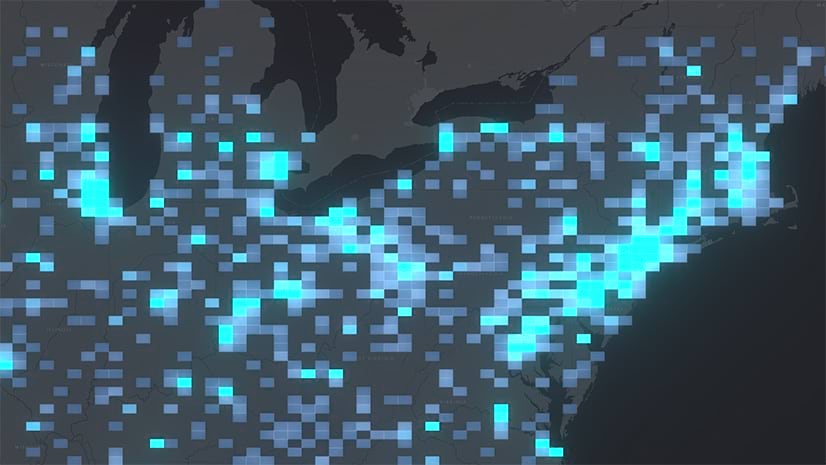
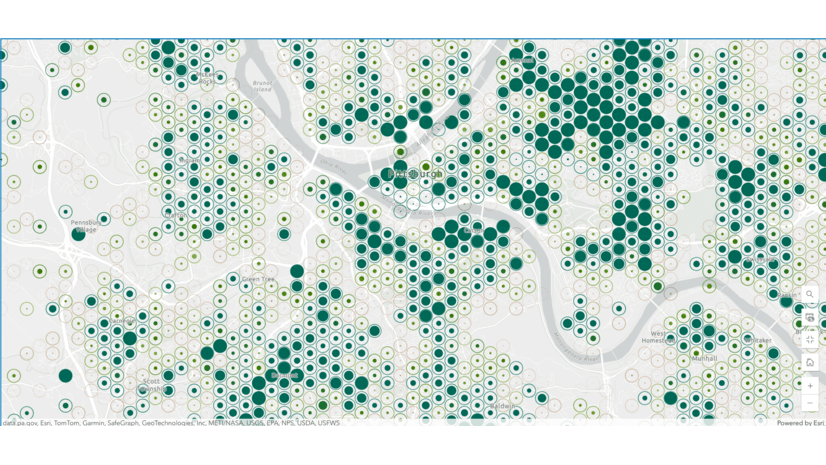
To avoid the visual clutter of lots of overlapping circles on some maps, we’ve become big fans of using Reference Size maps applied to point data that has been binned into a regular grid. Map Viewer makes this a breeze using the Aggregation functions, so if you have point data (especially if you have a LOT of points!) bin those points to make the most attractive kinds of Reference Size maps possible. Below are some examples that show how clean the maps look when they don’t all overlap each other or have large gaps between symbols.
- Univariate map using just size
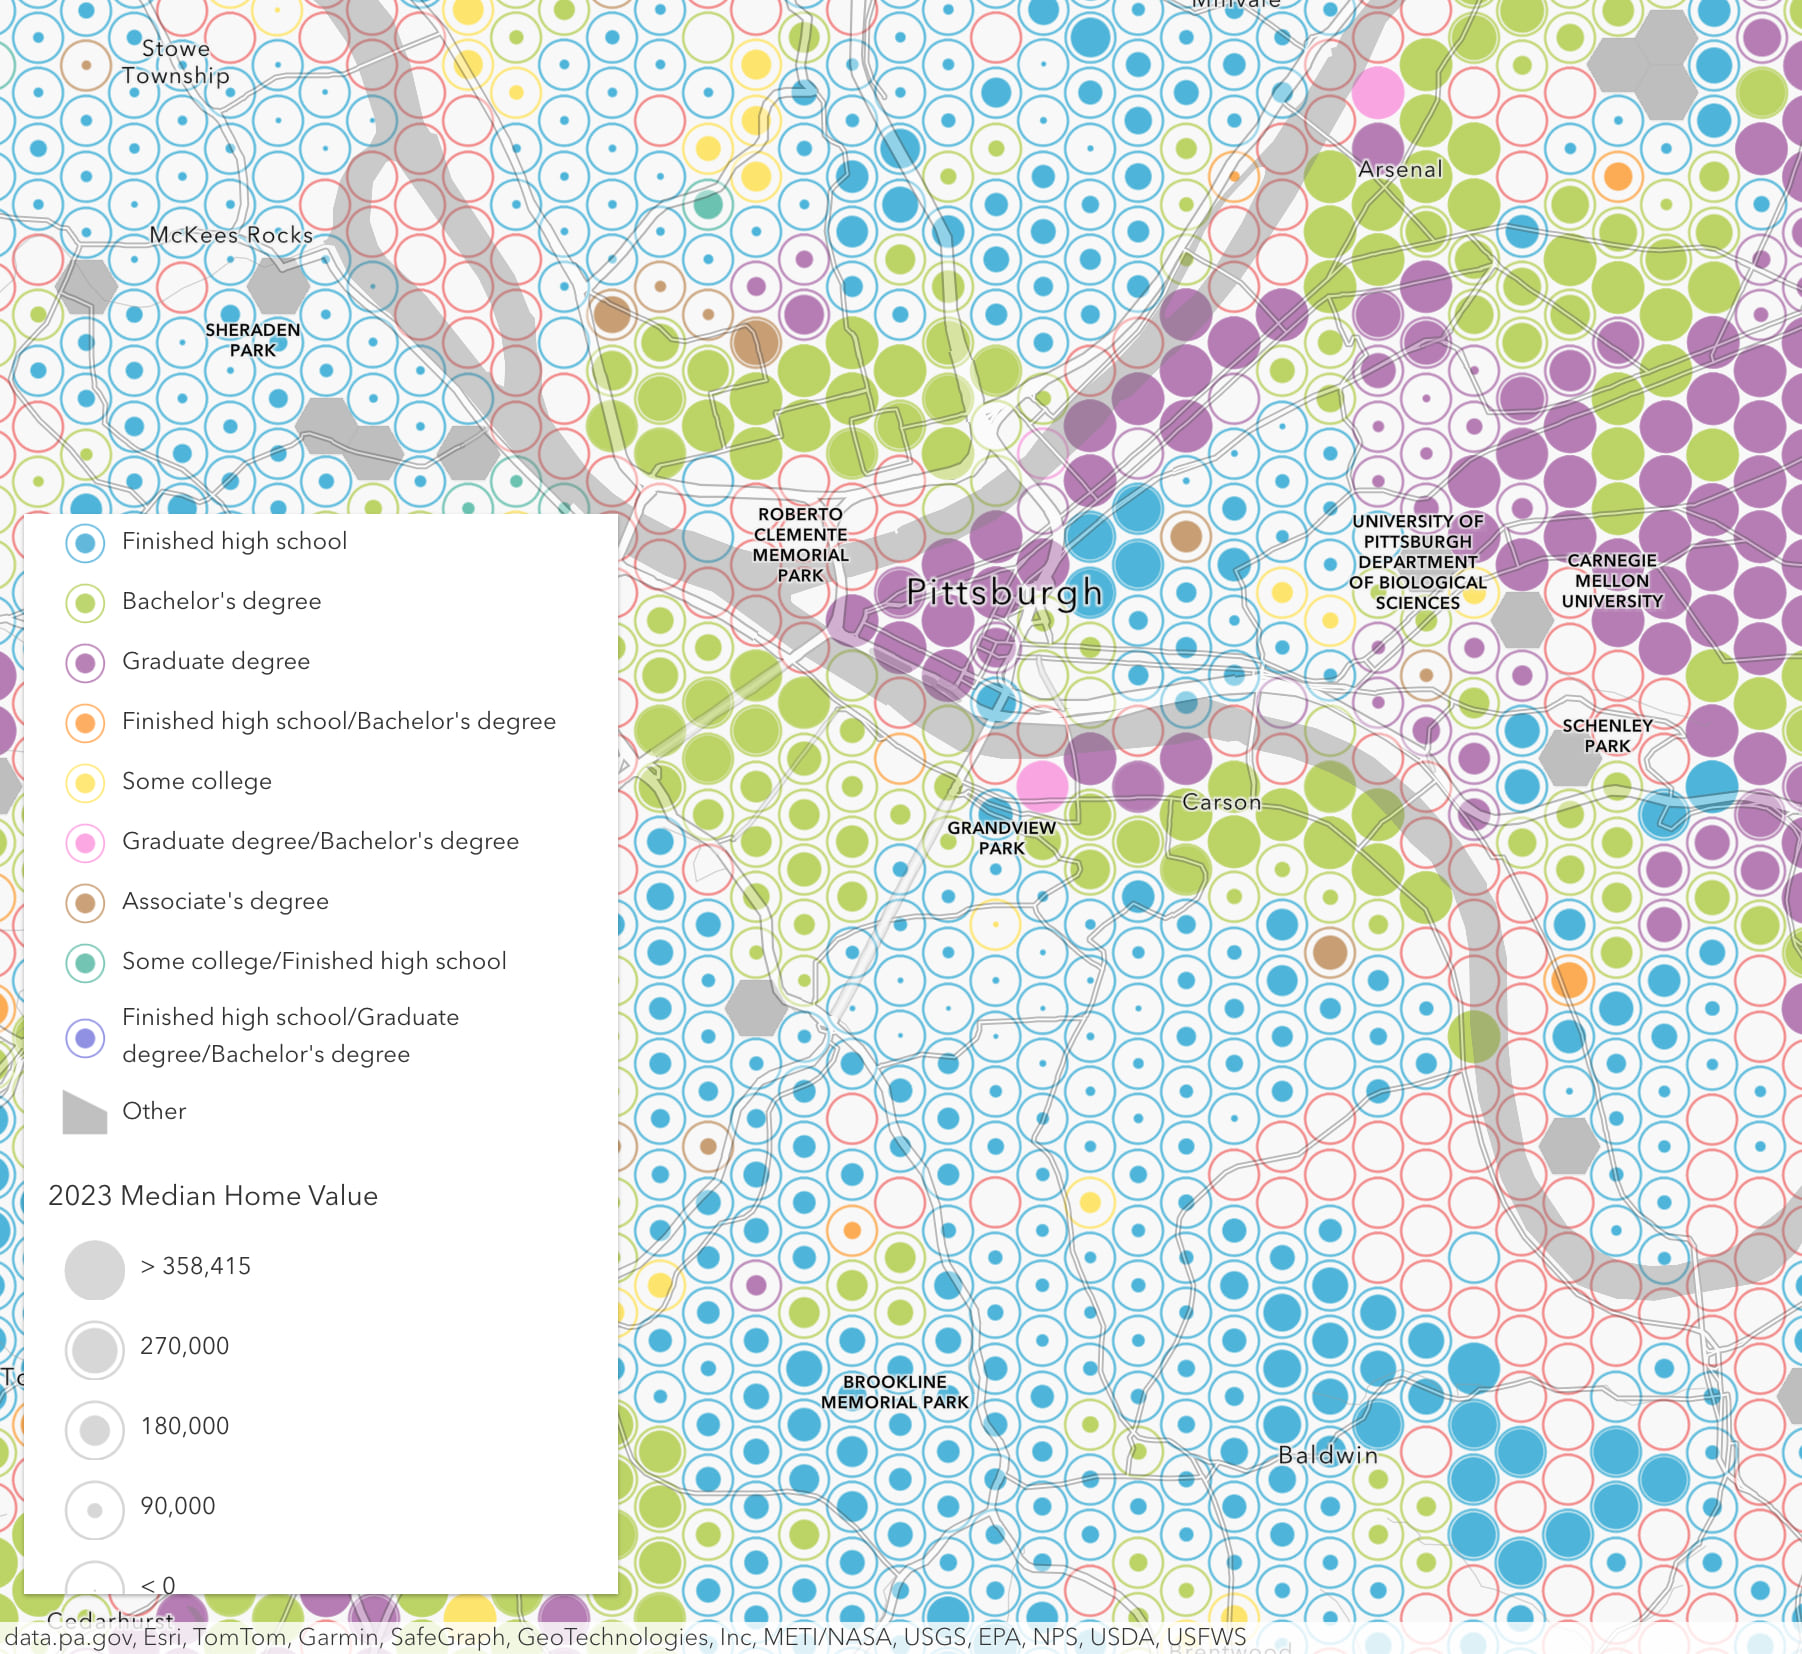
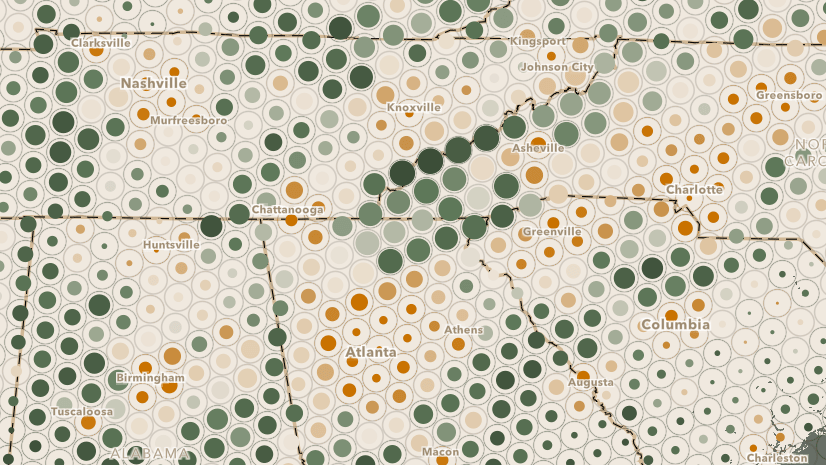
- Bivariate map showing one numeric attribute as size and another as color
- Bivariate map showing one numeric attribute as size and categorical attribute as color (predominance).
Next Steps
To go deeper and learn about the research behind all of this, I highly recommend watching Kristian Ekenes’ and Jeremy Bartley’s fabulous NACIS 2023 Presentation (Youtube Video). Then log into Map Viewer and test drive Reference Maps yourself; it only takes a minute or two to make maps like the ones above. Don’t forget to try adding more than one data variable, since Reference Size maps play nicely with other data varaibles 🙂 Happy mapping!


Article Discussion: