September 15, 2020
Social Media Meets Data Science – Geography Pulls It All Together
Social media often seems to provide little more than a distraction. Yet, the endless stream of commentary, criticism, photos, and videos also enhances communication for an estimated 3.6 billion users worldwide—and yields valuable information about people, needs, and issues.
Developers and data scientists can aggregate and analyze social media posts to obtain real-time information that can be applied to a wide range of issues—including traffic congestion mitigation, natural disaster monitoring and response, and disease outbreak detection. At the Center for Human Dynamics in the Mobile Age (HDMA), founded in 2013 at San Diego State University, researchers are doing just that.
HDMA cross-disciplinary teams develop computational models about human dynamics and transformative scientific theories by applying big data and data science techniques on social media platforms.
“We are focused on transforming academic research into information and understanding that can be used for public policy change or real-time decision-making,” said Ming-Hsiang Tsou, professor of geography and director of HDMA. “Programs of this type point to the future of education because they have the potential to address real needs, rather than purely academic research.”
Location Connects Data and Disciplines
HDMA researchers pull data feeds from GPS devices, environmental sensors, monitoring instruments, and social media platforms. Disciplines included in the groups’ studies range from computer science, civil engineering, sociology, public health, and linguistics to management information systems, accounting, communication, social work, digital humanities, and public affairs.
Geography has become central to the work, empowering teams to specify where an event has occurred and providing contextual knowledge to guide actions.
“By its nature, [social media] data is big, messy, unstructured, and noisy,” Tsou said. “The key concepts of geography—place, time, and scale—can help data scientists clean the noise, understand the context, and answer the questions about when and where.”

Tsou shares the example of data analysis of Twitter regarding flu outbreaks. The inclusion of geographic location in these feeds can prompt public health agencies to allocate vaccines at the right time to specific affected regions. In this case, the ability to identify hot spots and compare results within cities or regions can guide targeted actions.
Social media data can also fill in data gaps for more traditional geographic analysis, such as understanding land-use patterns. One example was an effort to determine urban land-use patterns in Beijing, China.
Researchers collected 9.5 million geotagged messages from social media platform Sina Weibo for six months in the urban core areas of Beijing and compared them with 385,792 commercial points of interest from Datatang, a Chinese digital data content provider.
“By analyzing the temporal frequency trends of social media messages, we identified seven types of land-use clusters in Beijing: residential areas, university dormitories, commercial areas, work areas, transportation hubs, and two types of mixed land-use areas,” Tsou said.
Tsou and others at HDMA say urban planners can use this methodology as a cost-effective way to create and analyze current land-use patterns, and, ultimately, to better understand dynamic human activity patterns within a city.
Developing Solutions to Quiet Noisy Data
The team at HDMA has developed several computer programs to automatically or semiautomatically collect social media data from Twitter, Sina Weibo, Google Places, and Reddit. HDMA then imports the data into a geographic information system (GIS) for location analysis across space and time.
HDMA has also created two software toolsets to analyze and display the data it collects from social media platforms.

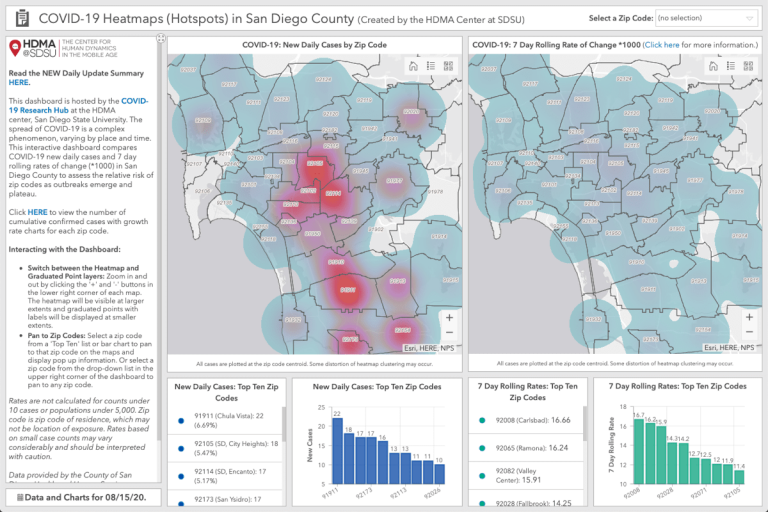
The Social Media Analytic and Research Testbed (SMART) Dashboard monitors and aggregates information related to changes in social behavior, providing insight into how a local population is responding to an event or situation. The dashboard has been used to track the spread of Ebola, ovarian cancer clusters, wildfires, hurricanes, and marijuana legalization initiatives.

A web-based mapping application called Geo-targeted Event Observation (Geo) Viewer visualizes the results of the geotagged social media analyses performed by HDMA researchers. It provides easy-to-use geospatial functions such as the display of hot spot and cluster data layers, storage of multimedia images including photos and videos, and mapping of historic and real-time social media data.
While the applications can be important assets for emergency response and other crucial activities, privacy is an important consideration. Metadata collected by social media platforms includes personal information such as the identity of the author, when the post occurred, a geotagged location of the post, the content of the post itself, and the number of reposts. Tsou said the HDMA team is careful with sensitive data, employing geomasking techniques to randomize the actual geotagged locations of users.
Looking ahead, Tsou foresees tighter integration between GIS and data science—a discipline he calls geospatial data science that “will facilitate critical spatial thinking and problem solving for various applications and industries and enable the exploration of new scientific theories.”
Learn more about how data scientists use GIS to uncover hidden patterns and improve predictive modeling.