Growing up in Philadelphia, everyone in my neighborhood was Black. My elementary school was at the border of all-Black and all-Latinx neighborhoods, and our school makeup reflected that. The only White people I saw in my daily life were teachers at school. I didn’t realize this was all by design until several years into my career using GIS.
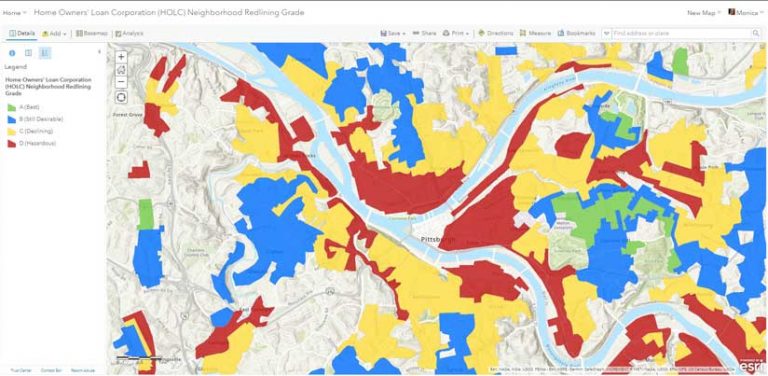
GIS helped me connect Philadelphia’s racially segregated communities to the limits to prosperity for non-White Americans. I learned that beginning in the 1930s, more than 200 cities across the country were redlined, yellowlined, or greenlined by a federal agency. The Home Owners’ Loan Corporation (HOLC) created maps guiding efforts promoting systemic racism. A neighborhood ranking system guided real estate developers and appraisers in cities across the US. The neighborhoods deemed hazardous were marked as red on the map. The racial bias of this action is the origin of the term redlining, which has become synonymous with government policies that underpin systemic racism.
It was clear to me that GIS could be a tool for unraveling racism and designing a better future. I’d heard about redlining as a thing of the past, but my work in GIS for the City of Philadelphia exposed me to continuing patterns. Work to support the city’s reinvestment fund got me excited about using GIS as a tool to uncover and eliminate racial injustices that plague my friends, family, and community.
I joined Esri to expand my focus beyond a single city—and leverage my lived experience—by helping cities, counties, and organizations address racial and social inequality. About a year and a half ago, I founded NorthStar to connect students, professionals, and entrepreneurs of African descent to collaborate to increase the representation of Black people in GIS and advocate for the use of GIS to advance equity and social justice.
In the wake of the senseless and horrific killings of George Floyd, Breonna Taylor, and Ahmaud Arbery, Esri launched a Racial Equity initiative, which I lead. This work focuses on the application of GIS and mapping to address racial inequities and involves developing datasets and solutions; creating education materials in the form of demos, videos, webinars, courses, and lessons; and capturing and sharing maps and stories to elevate best practices.
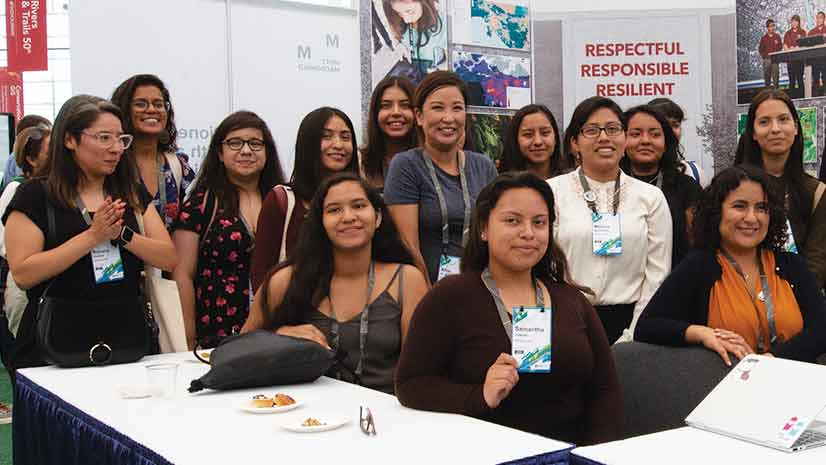
At the recent virtual Esri User Conference, a Homecoming [a week-long virtual gathering of GIS professionals of African descent was organized by NorthStar and Blacks in GIS] to provide a place for sharing perspectives. We spoke about equity, inclusivity, unity, and our power to make a difference. During the Homecoming, Adrian Gardner and I spoke about the African continent, what’s going on there, and how people of color in different countries have different experiences. The following personal accounts by Adrian Gardner, Valrie Grant, and Jennifer Johnson were related to us. They describe what it means to be a Black GIS user.
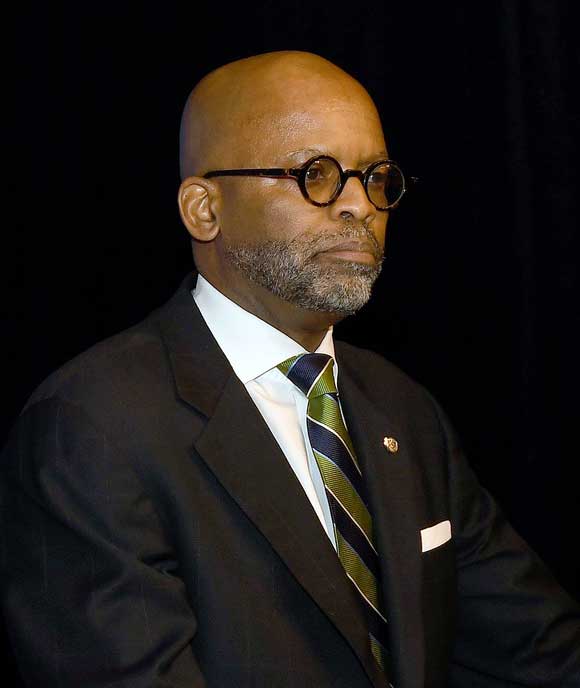
Adrian Gardner was the longest-serving CIO at the United States Federal Emergency Management Agency (FEMA) when he retired two years ago. He since founded SmarTech Nexus, (STN) a nonprofit that uses GIS, data analytics, and artificial intelligence (AI) to empower at-risk and underserved communities.
I’ve walked through my life very differently than somebody who does not look like me. I was born in Germany, went to high school in the US Virgin Islands and college at Tuskegee Institute, and joined the US Air Force as a second lieutenant straight out of college. I spent four years in Sicily and have done a lot of international travel for work and pleasure.
I have seen and lived how people of color are treated in different countries. Much like life in the US, it doesn’t matter how high Black individuals rise in their community or profession; they are still at risk of racial profiling in the street and the boardroom. For the longest time, when I was growing up, the rest of the world wanted to model the US. Now, I see other countries showing the US how to make more equitable decisions.
Some of the GIS work of the United Nations (UN) gives us an opportunity to look at and compare, the capacity of different countries. What are those puts and takes, and how do we get all boats to rise to the same level? Geospatial technology provides the opportunity for storytelling—setting issues in context to make them visible so that we can learn from them and then repeat what worked well.
When I was at FEMA, we used GIS to understand and confirm whether dollars and support for underserved and at-risk communities were equitable. GIS provided us with the tools to look at the agency’s decision-making practices, to ensure alignment between the people requiring disaster relief and the people that received it. Often, the data speaks for itself.
GIS is central to the way our organization, SmarTech Nexus, looks at assets within a community. The technology can empower communities to participate in decisions that impact them. STN is focused on two underutilized assets that exist in every community: opportunity youth and faith-based organizations. An opportunity youth is an individual between the ages of 16 and 24 who is not employed and not in school. Faith-based organizations serve as fulfillment centers for goods and services.
We are engaging young people in the practices of mapping their communities and empowering the next generation through GIS to thrive and survive in the skill-based economy. Our goal is to reduce the number of socially disconnected people in underserved communities by 500,000 over five years.
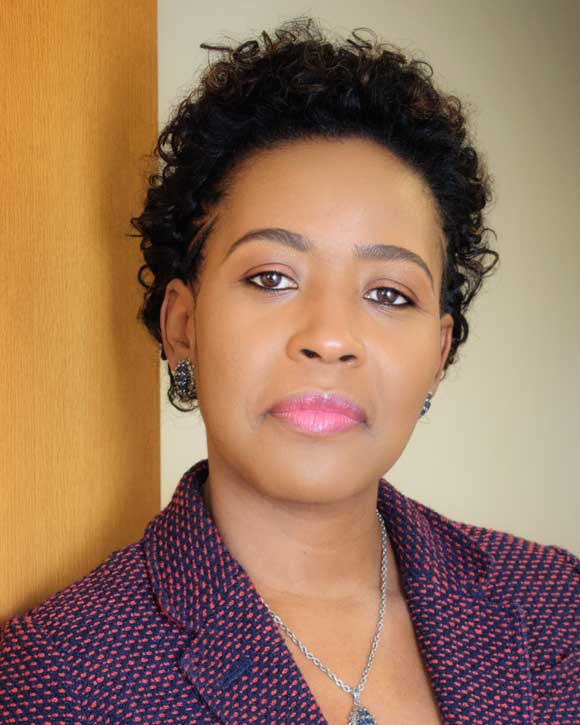
Valrie Grant, GISP, calls herself a location intelligence strategist. She founded GeoTechVision, an Esri partner, and is the executive chairman of the Marlie Technology Park.
I grew up in the countryside in Jamaica, where I was socialized to think that everybody is equal. When I entered the international scene and ventured to other places, I realized that was not the case elsewhere. Black Americans have a different perspective than Caribbean Blacks, probably because we are the majority in our countries, and racism isn’t as prevalent.
If you think about society as a body, every part has a different function. The hand may not be as important as the heart, but if you take any of it away, you’re just not the same. If society will recognize the value of everyone, we will be so much better for it. At the end of the day, your class or race doesn’t matter, and we all make valuable contributions. I operate like that in every sphere.
Doing things together can have an impact, which is the foundation of what geospatial technology has always been for me. It’s all about creating opportunities for ethnically diverse communities. GIS shines a light on inequities, and COVID-19 has shown that people are suffering based on where they live and the opportunities they have. It’s heartening to come together as a group to collaborate and innovate.
In 2006, I founded the Caribbean chapter of the Urban and Regional Information Systems Association (URISA). We are building on these efforts with the support of the UN-Global Geospatial Information Management (GGIM) Americas Caribbean project, which began in 2014. We now have developed a close-knit geospatial group, with some 16 Caribbean countries participating, and we are having dialogue on the international and regional level.
I lead the UN-GGIM [Global Geospatial Information Management] Americas Private Sector Network. I’m also the only Caribbean representative on the World Geospatial Industry Council. You mostly see gray suits, so I’m glad to be there to represent Black women.
One of my passions is youth and education. I think opportunities should be afforded to everyone, not just the people who were born with access. With COVID-19, education has stopped in underserved communities where they don’t have access to technology—computers or the internet.
We formed an initiative called EduTech Aid to provide children with tablet computers and enable access to materials so they can continue learning. We recently partnered with the Association of Caribbean States on a series of webinars on equity in education. We’re collecting data about broadband access—the location of internet deserts—and we’re mapping that to inform policy changes. We’re trying to collect as much information as possible to be able to say to the decision-makers, This is the real picture on the ground. What are the solutions?

Jennifer Johnson is a senior GIS analyst at the engineering firm HDR, Inc., a company that prides itself on inclusion and diversity that reflects the communities where it does business.
At HDR, we have a long list of team members on most projects that reflects the diverse communities we serve. Our diversity extends beyond race, age, and gender with a variety of disciplines. The inclusion and representation of different backgrounds are very important for any type of work that serves a wide variety of communities, and I’m proud to have an employer that recognizes that.
The COVID-19 crisis makes us all feel so physically exhausted, mentally overwhelmed and fearful of what’s next. It’s very important to not only stay positive and hopeful for the future but also have an understanding that the impact of this virus has been more pronounced in minority communities. The power of GIS has shown us that impact nationwide and allowed us to explore other patterns of the virus worldwide. As individuals, we can use this knowledge to be more compassionate and responsible to prevent the spread of the virus on a daily basis.
COVID-19 has also impacted the way we work. At HDR we are using GIS to provide dynamic tools that track and manage our capacity for staffing our offices responsibly. I personally work from home, but for many, the office is a more productive environment. Our GIS team collaborated with administrative staff, human resources, and office management to provide an Esri mapping solution that supports our goal to make our office a safer environment for colleagues and clients.
Growing up in Philadelphia gave me a unique perspective. What was most astonishing was realizing how maps had historically impacted those communities. Redlining is a perfect example of how a lack of inclusion (when it comes to shaping our society) can be detrimental to generations nationwide. We still see effects today when it comes to commercial investment, landownership, and criminalization.
When I earned my position as a lead GIS analyst for the City of Philadelphia, I worked with a team to build an index of data to identify the impacts of education, drugs, crime, income, housing, accessibility, and many other variables, and provide policy makers with data-driven recommendations. That team has since continued to evolve what’s now called the Stress Index, and it is a useful resource for the public to monitor and address important equity issues in Philadelphia.
After a few years with the CityGeo team in Philadelphia, I found myself in Nashville, working as a geodesign specialist for the Metro Planning Department. This position tied in very well with my knowledge of design and my passion for 3D GIS. Moving to Nashville was a professional and cultural adjustment but landing in the planning department meant that a big part of my job was to get to know my new city. I’ve now been in Nashville for almost four years and have found that everything I’ve learned along the way has prepared me for my current role as a senior GIS analyst at HDR.
My personal objective has always been to sustain myself doing what I love and be a positive representation of those who have similar backgrounds. As an African-American woman in tech and design, I feel a sense of responsibility to progress and open doors for more inclusivity. Often, if you don’t see a representation of yourself in a particular career path, it can seem unattainable, so I’m hoping I can lead by example. As my career progresses, I intend to be the change I want to see in the industry by continuing to provide my unique perspective in future collaborations and uplifting other professionals who also have a passion for GIS. If we can learn from one another, we can overcome challenges more effectively as a team.
Resources for Addressing Racial Equity
To learn how governments, nonprofits, and businesses can address racial inequity, visit Esri’s Racial Equity website (esri.com/en-us/racial-equity). The GIS resources on the Racial Equity GIS Hub (gis-for-racialequity.hub.arcgis.com), allow more in-depth analysis of these issues.
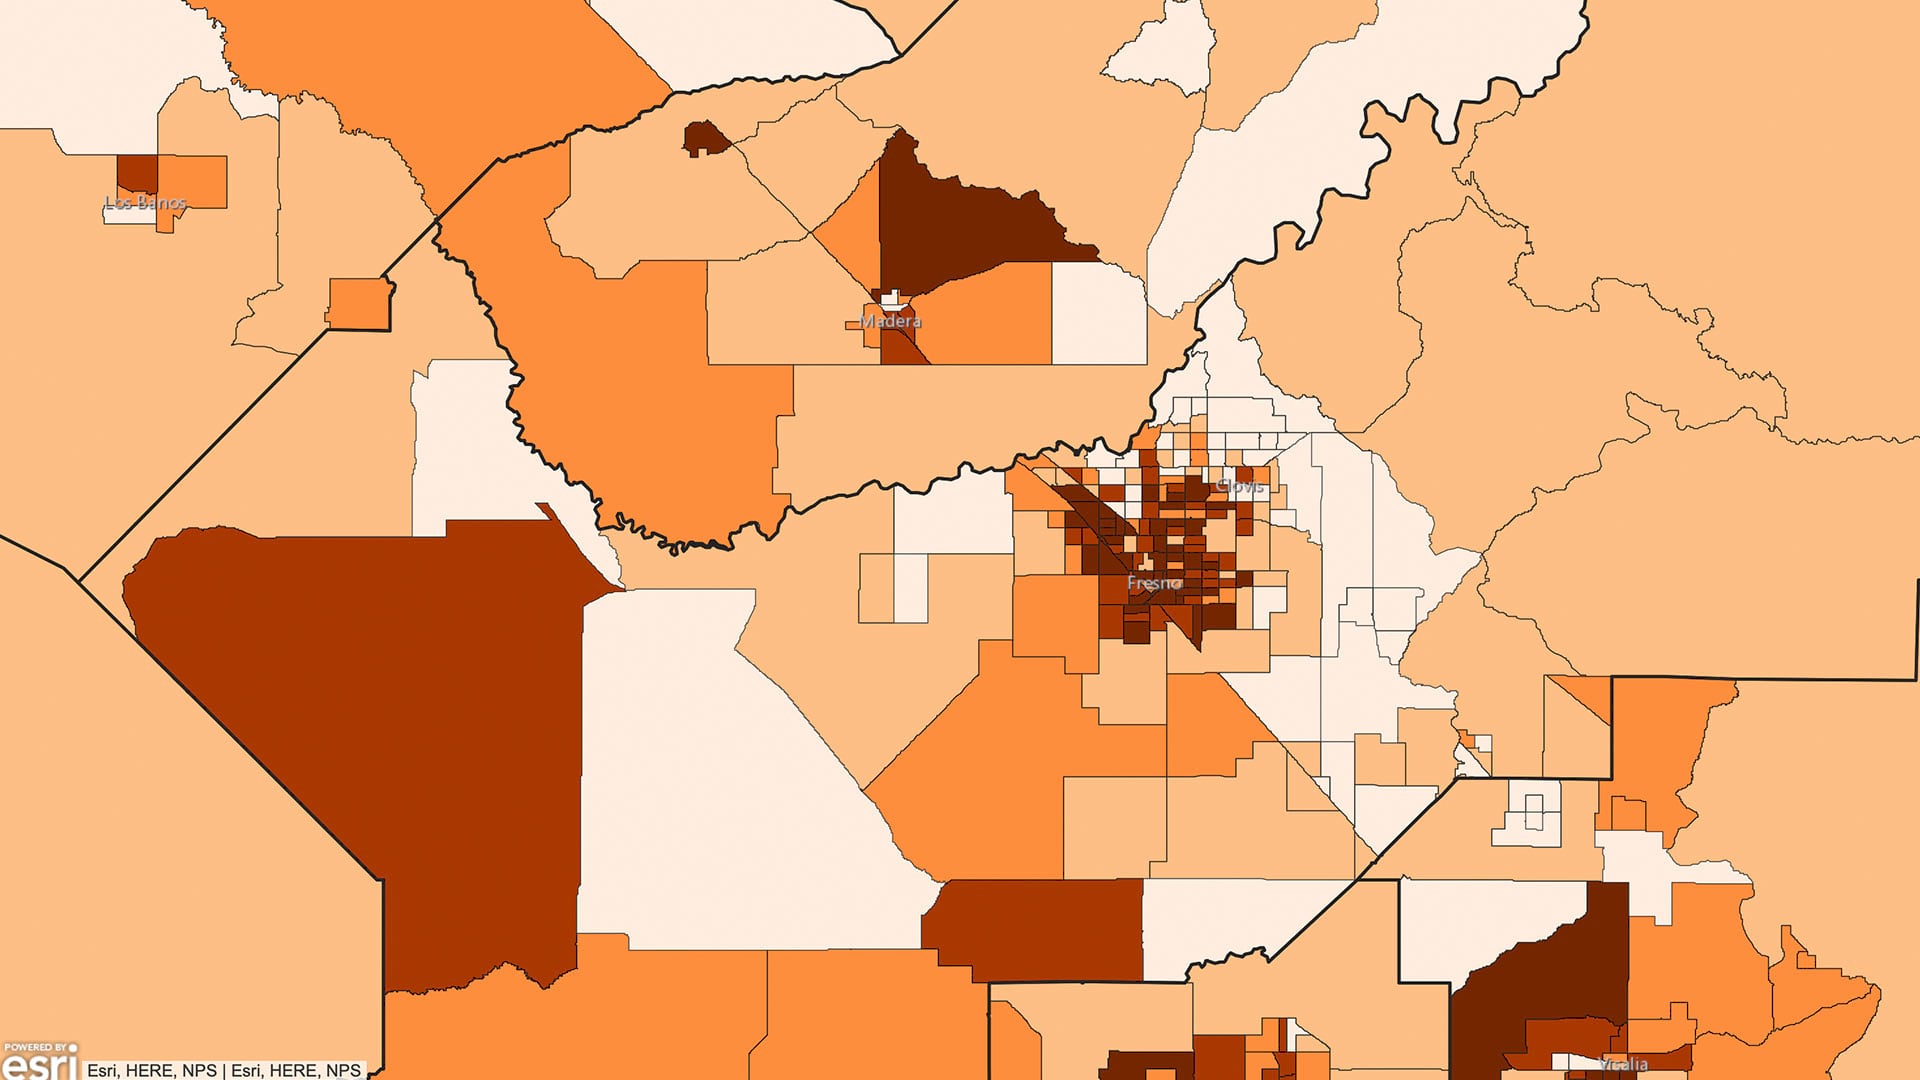
GIS-ready historical redlining data for 143 cities is available to help GIS users and policy makers understand how historical inequities continue today because these formerly redlined neighborhoods have fewer resources such as quality schools, access to fresh foods, and health-care facilities. Research by the Science Museum of Virginia has found a link between urban heat islands [urban areas where temperatures are higher than surrounding rural areas as the result of human activities] and redlining. These historical data layers can be leveraged to advance equity and social justice in communities. See “Effectively Present Information about race/Ethnicity (or Any Group)” in the Summer 2020 issue of ArcUser.